| CATEGORY OF SCHEME | Multicap Fund |
| INVESTMENT OBJECTIVE | The investment objective of the Scheme is to generate long-term capital appreciation from a diversified portfolio that predominantly invests in equity and equity-related securities of companies across various market capitalisation. However, there can be no assurance that the investment objective of the Scheme will be realised. |
| Inception Date (Date of Allotment): | 15-May-19 |
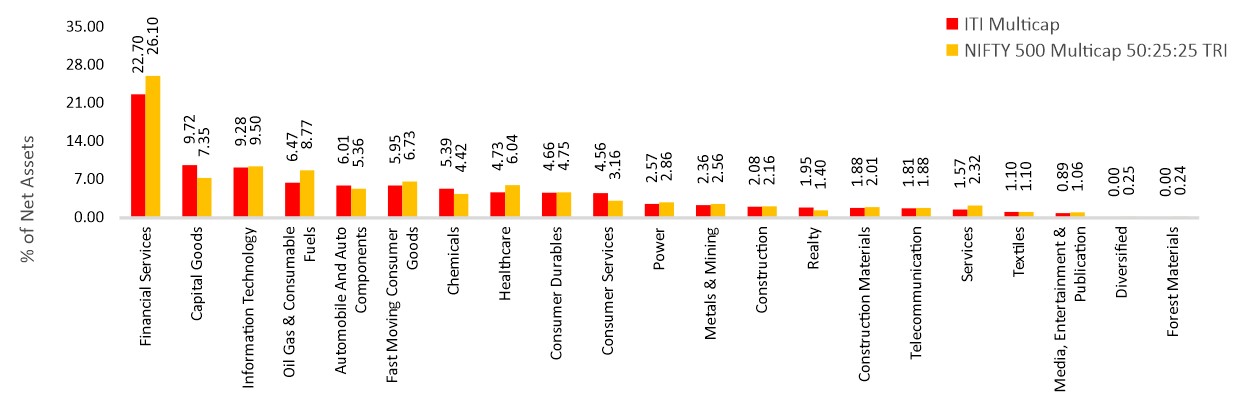
| Benchmark: | Nifty 500 Multicap 50:25:25 TRI |
| Minimum Application Amount: | Rs.1,000/- and in multiples of Rs. 1/- thereafter |
| Load Structure: | Entry Load: Nil Exit Load: 1% if redeemed or switched out on or before completion of 3 months from the date of allotment of units · Nil, if redeemed or switched out after completion of 3 months from the date of allotment of units. |
| Total Expense Ratio (TER): | Including Additional Expenses and Goods and Service
Tax on Management Fees |
| Fund Manager | Mr. Dhimant Shah (Since 08 August 2022) Total Experience : 26 years Mr. Pratibh Agarwal (Since 29 April 2022) Total Experience : 11 years |
| AUM (in Rs. Cr): | 440.22 |
| AAUM (in Rs. Cr): | 423.88 |
| % of top 5 holdings: | 16.66% |
| % of top 10 holdings: | 26.75% |
| No. of scrips: | 85 |
| Standard Deviation^: | 21.22% |
| Beta^: | 0.94 |
| Sharpe Ratio^*: | 0.27 |
| Average P/B | 6.53 |
| Average P/E | 36.69 |
| ^Computed for the 3-yr period ended August 30, 2022.
Based on month-end NAV. * Risk free rate: 5.34 (Source: FIMMDA MIBOR) |
|
Regular Plan
(in Rs.) |
Direct Plan
(in Rs.) |
|
| Growth: | 13.8355 |
14.8482 |
| IDCW: | 13.2160 |
14.2057 |
Name of the Instrument |
% to
NAV |
% to NAV
Derivatives |
|
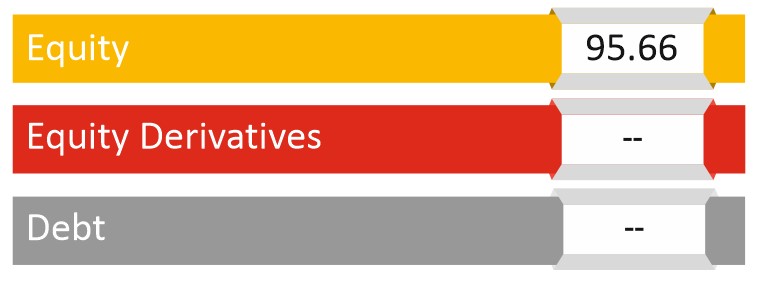
Equity & Equity Related Total |
95.66 |
||
Automobile and Auto Components |
6.01 |
||
Maruti Suzuki India Limited |
1.79 |
||
Eicher Motors Limited |
1.00 |
||
TVS Motor Company Limited |
0.99 |
||
Bosch Limited |
0.98 |
||
ZF Commercial Vehicle Control Systems India Limited |
0.64 |
||
Suprajit Engineering Limited |
0.60 |
||
Capital Goods |
9.72 |
||
Bharat Electronics Limited |
1.36 |
||
AIA Engineering Limited |
1.01 |
||
Thermax Limited |
1.00 |
||
Timken India Limited |
0.99 |
||
Cummins India Limited |
0.93 |
||
Bharat Dynamics Limited |
0.90 |
||
ABB India Limited |
0.77 |
||
Syrma SGS Technology Limited |
0.59 |
||
MTAR Technologies Limited |
0.57 |
||
Greaves Cotton Limited |
0.56 |
||
Hindustan Aeronautics Limited |
0.55 |
||
Jindal Stainless (Hisar) Limited |
0.48 |
||
Chemicals |
5.39 |
||
Gujarat Fluorochemicals Limited |
2.02 |
||
Galaxy Surfactants Limited |
1.08 |
||
PI Industries Limited |
0.99 |
||
Astec LifeSciences Limited |
0.74 |
||
Solar Industries India Limited |
0.57 |
||
Construction |
2.08 |
||
Larsen & Toubro Limited |
1.20 |
||
PNC Infratech Limited |
0.88 |
||
Construction Materials |
1.88 |
||
ACC Limited |
1.00 |
||
Grasim Industries Limited |
0.87 |
||
Consumer Durables |
4.66 |
||
Voltas Limited |
1.05 |
||
TTK Prestige Limited |
1.01 |
||
Titan Company Limited |
0.77 |
||
La Opala RG Limited |
0.71 |
||
Cera Sanitaryware Limited |
0.60 |
||
Crompton Greaves Consumer Electricals Limited |
0.51 |
||
Consumer Services |
4.56 |
||
Aditya Birla Fashion and Retail Limited |
1.72 |
||
Wonderla Holidays Limited |
1.55 |
||
The Indian Hotels Company Limited |
1.01 |
||
Taj GVK Hotels & Resorts Limited |
0.28 |
||
Fast Moving Consumer Goods |
5.95 |
||
ITC Limited |
2.49 |
||
Hindustan Unilever Limited |
1.33 |
||
Emami Limited |
0.98 |
||
Procter & Gamble Hygiene and Health Care Limited |
0.91 |
||
CCL Products (India) Limited |
0.24 |
||
Financial Services |
22.70 |
||
HDFC Bank Limited |
3.39 |
||
ICICI Bank Limited |
3.33 |
||
Housing Development Finance Corporation Limited |
2.37 |
||
Kotak Mahindra Bank Limited |
2.11 |
||
State Bank of India |
1.19 |
||
Cholamandalam Financial Holdings Limited |
1.14 |
||
Karur Vysya Bank Limited |
1.13 |
||
Max Financial Services Limited |
1.12 |
||
IDFC Limited |
1.09 |
||
Bajaj Finance Limited |
1.08 |
||
Axis Bank Limited |
1.05 |
||
Bajaj Finserv Limited |
1.03 |
||
The Federal Bank Limited |
1.03 |
||
HDFC Life Insurance Company Limited |
0.96 |
||
UTI Asset Management Company Limited |
0.68 |
||
Healthcare |
4.73 |
||
Sun Pharmaceutical Industries Limited |
1.12 |
||
Aster DM Healthcare Limited |
1.04 |
||
Narayana Hrudayalaya Limited |
0.95 |
||
Lupin Limited |
0.94 |
||
Natco Pharma Limited |
0.68 |
||
Information Technology |
9.28 |
||
Infosys Limited |
3.11 |
||
Tata Consultancy Services Limited |
1.26 |
||
L&T Technology Services Limited |
1.18 |
||
Cyient Limited |
1.09 |
||
KPIT Technologies Limited |
1.06 |
||
Tech Mahindra Limited |
0.77 |
||
MphasiS Limited |
0.47 |
||
Larsen & Toubro Infotech Limited |
0.34 |
||
Media, Entertainment & Publication |
0.89 |
||
Sun TV Network Limited |
0.89 |
||
Metals & Mining |
2.36 |
||
Jindal Steel & Power Limited |
1.36 |
||
Hindalco Industries Limited |
1.00 |
||
Oil Gas & Consumable Fuels |
6.47 |
||
Reliance Industries Limited |
4.34 |
||
Chennai Petroleum Corporation Limited |
1.12 |
||
Coal India Limited |
1.01 |
||
Power |
2.57 |
||
NTPC Limited |
1.54 |
||
Power Grid Corporation of India Limited |
1.03 |
||
Realty |
1.95 |
||
Prestige Estates Projects Limited |
0.94 |
||
Mahindra Lifespace Developers Limited |
0.53 |
||
Oberoi Realty Limited |
0.48 |
||
Services |
1.57 |
||
Blue Dart Express Limited |
1.31 |
||
VRL Logistics Limited |
0.26 |
||
Telecommunication |
1.81 |
||
Bharti Airtel Limited |
1.81 |
||
Textiles |
1.10 |
||
Page Industries Limited |
1.10 |
||
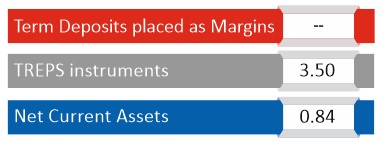
Short Term Debt & Net Current Assets |
4.34 |
Top Ten Holdings
| Fresh, no legacy/no baggage portfolio | |
| Smooth investing experience for the investor | |
| Long term wealth creation focus | |
| Strong expertise in equity research | |
| Differently positioned as a flexi cap within the multicap segment | |
| When markets are expensive, the fund generally reduces risk and when markets are undervalued fund increases the risk in the portfolio so that risk adjusted return and investor experience can be reasonable |
Value of Investment of 10,000 |
||||||
| Period | Fund Returns (%) |
Benchmark Returns (%) |
Additional Benchmark Returns (%) |
Fund () |
Benchmark () |
Additional Benchmark () |
Regular - Growth |
||||||
Last 1 Year |
-1.80% |
7.48% |
5.16% |
9,820 |
10,746 |
10,514 |
Last 3 Years |
11.11% |
23.97% |
18.63% |
13,721 |
19,062 |
16,701 |
Since Inception |
10.35% |
20.26% |
16.70% |
13,836 |
18,366 |
16,636 |
Direct - Growth |
||||||
Last 1 Year |
0.33% |
7.48% |
5.16% |
10,033 |
10,746 |
10,514 |
Last 3 Years |
13.53% |
23.97% |
18.63% |
14,638 |
19,062 |
16,701 |
Since Inception |
12.74% |
20.26% |
16.70% |
14,848 |
18,366 |
16,636 |
Past performance may or may not be sustained in future. Different Plans i.e. Regular Plan and Direct Plan under the scheme have different expense structure. Benchmark: Nifty 500 Multicap 50:25:25 TRI # Additional Benchmark: Nifty 50 TRI. Fund Managers: Ms. Hetal Gada Since (Since 7-March-2022). and Mr. Pratibh Agarwal (Since 29 April 2022). Inception date of the scheme (15-May-19). Face Value per unit: Rs. 10.
| Period | Amount Invested |
Fund Value () |
Fund Returns (%) |
Benchmark Value () |
Benchmark Returns (%) |
Additional Benchmark Value () |
Additional Benchmark Returns (%) |
Regular - Growth |
|||||||
Last 1 Year |
120000 |
123027 |
4.74% |
125981 |
9.42% |
125552 |
8.74% |
Last 3 Years |
360000 |
432207 |
12.27% |
528772 |
26.70% |
489948 |
21.13% |
Since Inception |
390000 |
472374 |
11.85% |
582229 |
25.55% |
537671 |
20.23% |
Direct - Growth |
|||||||
Last 1 Year |
120000 |
124418 |
6.93% |
125981 |
9.42% |
125552 |
8.74% |
Last 3 Years |
360000 |
447839 |
14.74% |
528772 |
26.70% |
489948 |
21.13% |
Since Inception |
390000 |
490832 |
14.30% |
582229 |
25.55% |
537671 |
20.23% |
Past performance may or may not be sustained in future. Different Plans i.e. Regular Plan and Direct Plan under the scheme have different expense structure. Benchmark: Nifty 500 Multicap 50:25:25 TRI # Additional Benchmark: Nifty 50 TRI. For SIP returns, monthly investment of Rs.10,000 invested on the 1st business day of every month has been considered. CAGR Returns (%) are computed after accounting for the cash flow by using the XIRR method (investment internal rate of return).
Disclaimer - Fund SIP Performance
The performance details provided herein are of Growth option under Direct and Regular Plans. The Fund(s) offer Systematic Investment Plan (SIP) facility. To illustrate the advantages of SIP investments, this is how your investments would have grown if you had invested say Rs. 10,000 systematically on the first Business Day of every month over a period of time in the Growth Option of respective scheme. The returns are calculated by XIRR approach assuming investment of 10,000/- on the 1st working day of every month. XIRR helps in calculating return on investments given an initial and final value and a series of cash inflows and outflows with correct allowance for the time impact of the transactions.
Record Date |
Plan(s) Option(s) |
Individuals/ HUF (IDCW) (Rs per unit) |
Others (IDCW) (Rs per unit) |
Cum-IDCW NAV (Rs per unit) |
22-Dec-20 |
Regular Plan - IDCW Option |
0.5000 |
0.5000 |
11.1650 |
22-Dec-20 |
Direct Plan - IDCW Option |
0.5000 |
0.5000 |
11.5566 |
Pursuant to payment of IDCW, the NAV of the IDCW Option(s) of the Scheme/Plan(s) falls to the extent of payout and statutory levy, if any. Past performance may or may not be sustained in future and should not be used as a basis for comparison with other investments. For complete list of IDCW, visit www.itiamc.com.
THIS PRODUCT IS SUITABLE FOR INVESTORS WHO ARE SEEKING^
- Long-term capital growth
- Investment in equity and equity-related securities of companies across various market capitalization
^Investors should consult their financial advisers if in doubt about whether the product is suitable for them.

Face Value per Unit: Rs. 10 unless other wise specified; Data is as of August 31, 2022 unless other wise specified
Mutual Fund investments are subject to market risks, read all scheme related documents carefully