| CATEGORY OF SCHEME | ELSS Fund |
| INVESTMENT OBJECTIVE | To provide long-term capital appreciation by investing predominantly in equity and equity related securities. However, there is no assurance or guarantee that the investment objective of the Scheme will be achieved. The scheme does not assure or guarantee any returns. |
| Inception Date (Date of Allotment): | 18-Oct-19 |
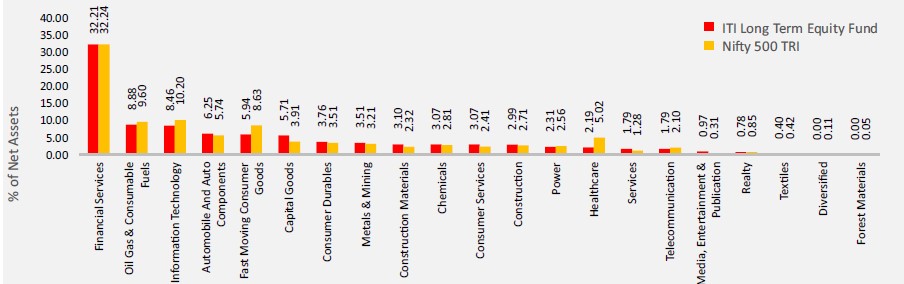
| Benchmark: | Nifty 500 TRI |
| Minimum Application Amount: | Rs. 500/- and in multiples of Rs. 500/- thereafter |
| Load Structure: | Entry Load: Nil Exit Load: Nil |
| Total Expense Ratio (TER): | Including Additional Expenses and Goods and Service
Tax on Management Fees |
| Fund Manager | Mr. Rohan Korde (Since 29 April 2022) Total Experience: 19 years Mr. Dhimant Shah (Since 01 December 2022) Total Experience : 26 years |
| AUM (in Rs. Cr): | 170.33 |
| AAUM (in Rs. Cr): | 166.49 |
| % of top 5 holdings: | 23.30% |
| % of top 10 holdings: | 36.32% |
| No. of scrips: | 73 |
| Standard Deviation^: | 15.38% |
| Beta^: | 0.88 |
| Sharpe Ratio^*: | 0.81 |
| Average P/B | 5.32 |
| Average P/E | 32.85 |
| ^Computed for the 3-yr period ended April 28,
2023. Based on daily NAV. * Risk free rate: 6.90 (Source: FIMMDA MIBOR) |
|
Regular Plan
(in Rs.) |
Direct Plan
(in Rs.) |
|
| Growth: | 14.2878 |
15.3994 |
| IDCW: | 13.6629 |
14.7432 |
Name of the Instrument |
% to
NAV |
% to NAV
Derivatives |
|
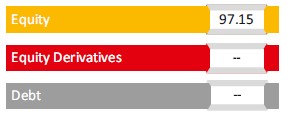
Equity & Equity Related Total |
97.15 |
||
Automobile and Auto Components |
6.25 |
||
Mahindra & Mahindra Limited |
1.24 |
||
Maruti Suzuki India Limited |
1.22 |
||
Bosch Limited |
1.05 |
||
Mahindra CIE Automotive Limited |
1.04 |
||
TVS Motor Company Limited |
0.97 |
||
ZF Commercial Vehicle Control Systems India Limited |
0.73 |
||
Capital Goods |
5.70 |
||
Hindustan Aeronautics Limited |
1.09 |
||
Siemens Limited |
1.00 |
||
Bharat Dynamics Limited |
0.99 |
||
Ashok Leyland Limited |
0.98 |
||
Prince Pipes And Fittings Limited |
0.93 |
||
Bharat Electronics Limited |
0.72 |
||
Chemicals |
3.07 |
||
Gujarat Fluorochemicals Limited |
1.50 |
||
Pidilite Industries Limited |
1.16 |
||
Astec LifeSciences Limited |
0.41 |
||
Construction |
2.99 |
||
Larsen & Toubro Limited |
2.01 |
||
PNC Infratech Limited |
0.98 |
||
Construction Materials |
3.10 |
||
UltraTech Cement Limited |
1.07 |
||
Ambuja Cements Limited |
1.05 |
||
Dalmia Bharat Limited |
0.98 |
||
Consumer Durables |
3.76 |
||
Titan Company Limited |
1.77 |
||
Crompton Greaves Consumer Electricals Limited |
1.00 |
||
La Opala RG Limited |
0.99 |
||
Consumer Services |
3.07 |
||
Aditya Birla Fashion and Retail Limited |
1.19 |
||
Trent Limited |
0.95 |
||
Avenue Supermarts Limited |
0.93 |
||
Fast Moving Consumer Goods |
5.94 |
||
ITC Limited |
3.13 |
||
Jyothy Labs Limited |
0.99 |
||
Hindustan Unilever Limited |
0.92 |
||
Emami Limited |
0.90 |
||
Financial Services |
32.20 |
||
HDFC Bank Limited |
5.62 |
||
ICICI Bank Limited |
5.08 |
||
State Bank of India |
3.19 |
||
Housing Development Finance Corporation Limited |
2.96 |
||
Kotak Mahindra Bank Limited |
2.71 |
||
Axis Bank Limited |
2.39 |
||
Bajaj Finance Limited |
1.50 |
||
SBI Life Insurance Company Limited |
1.23 |
||
Bank of Baroda |
1.06 |
||
The Federal Bank Limited |
0.93 |
||
CreditAccess Grameen Limited |
0.90 |
||
Cholamandalam Investment and Finance Company Ltd |
0.82 |
||
DCB Bank Limited |
0.77 |
||
Karur Vysya Bank Limited |
0.74 |
||
Max Financial Services Limited |
0.73 |
||
Sundaram Finance Limited |
0.66 |
||
UTI Asset Management Company Limited |
0.51 |
||
Multi Commodity Exchange of India Limited |
0.41 |
||
Healthcare |
2.19 |
||
Sun Pharmaceutical Industries Limited |
1.23 |
||
Aster DM Healthcare Limited |
0.95 |
||
Information Technology |
8.46 |
||
Infosys Limited |
2.95 |
||
Tata Consultancy Services Limited |
1.37 |
||
LTIMindtree Limited |
1.06 |
||
HCL Technologies Limited |
1.02 |
||
KPIT Technologies Limited |
0.92 |
||
Cyient Limited |
0.68 |
||
Tech Mahindra Limited |
0.45 |
||
Media, Entertainment & Publication |
0.97 |
||
Zee Entertainment Enterprises Limited |
0.97 |
||
Metals & Mining |
3.51 |
||
Jindal Stainless Limited |
1.98 |
||
Tata Steel Limited |
0.96 |
||
Hindalco Industries Limited |
0.57 |
||
Oil Gas & Consumable Fuels |
8.87 |
||
Reliance Industries Limited |
6.29 |
||
GAIL (India) Limited |
1.05 |
||
Coal India Limited |
1.04 |
||
Gulf Oil Lubricants India Limited |
0.50 |
||
Power |
2.32 |
||
NTPC Limited |
1.41 |
||
NLC India Limited |
0.90 |
||
Realty |
0.78 |
||
DLF Limited |
0.78 |
||
Services |
1.79 |
||
Blue Dart Express Limited |
0.76 |
||
InterGlobe Aviation Limited |
0.59 |
||
Redington Limited |
0.44 |
||
Telecommunication |
1.79 |
||
Bharti Airtel Limited |
1.79 |
||
Textiles |
0.40 |
||
Page Industries Limited |
0.40 |
||
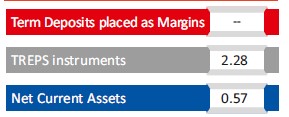
Short Term Debt & Net Current Assets |
2.85 |
|
Top Ten Holdings
| Tax benefits up to Rs 46,800 under Section 80C* | |
| Long term Wealth creation potential | |
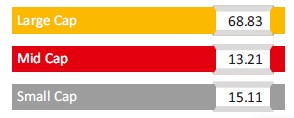
| Investors get an opportunity to invest in equities across market caps and sectors |
|
| Lowest lock in period of 3 years among all 80C Investments | |
| Strong expertise in equity research | |
| Tax saving through SIP builds discipline |
Value of Investment of 10,000 |
||||||
| Period | Fund Returns (%) |
Benchmark Returns (%) |
Additional Benchmark Returns (%) |
Fund () |
Benchmark () |
Additional Benchmark () |
Regular - Growth |
||||||
| Last 1 Year | 8.87% |
4.05% |
6.91% |
10,884 |
10,404 |
10,689 |
| Last 3 Years | 19.27% |
25.17% |
23.78% |
16,949 |
19,585 |
18,945 |
| Since Inception | 10.64% |
15.51% |
14.42% |
14,288 |
16,634 |
16,086 |
Direct - Growth |
||||||
| Last 1 Year | 11.06% |
4.05% |
6.91% |
11,103 |
10,404 |
10,689 |
| Last 3 Years | 21.82% |
25.17% |
23.78% |
18,059 |
19,585 |
18,945 |
| Since Inception | 13.01% |
15.51% |
14.42% |
15,399 |
16,634 |
16,086 |
Past performance may or may not be sustained in future. Different Plans i.e. Regular Plan and Direct Plan under the scheme have different expense structure. Benchmark: Nifty 500 TRI Additional Benchmark: Nifty 50 TRI. Fund Managers: Mr. Rohan Korde (Managing since 29-April-2022) and Mr. Dhimant Shah (Managing since 01- December - 2022). Inception date of the scheme (18-Oct-19). Face Value per unit: Rs. 10.
| Period | Amount Invested |
Fund Value () |
Fund Returns (%) |
Benchmark Value () |
Benchmark Returns (%) |
Additional Benchmark Value () |
Additional Benchmark Returns (%) |
Regular - Growth |
|||||||
| Last 1 Year | 120000 |
125566 |
8.88% |
123740 |
5.94% |
125330 |
8.49% |
| Last 3 Year | 360000 |
414444 |
9.43% |
445127 |
14.38% |
445256 |
14.40% |
| Since Inception | 420000 |
503286 |
10.39% |
550047 |
15.66% |
547427 |
15.38% |
Direct - Growth |
|||||||
| Last 1 Year | 120000 |
126879 |
11.00% |
123740 |
5.94% |
125330 |
8.49% |
| Last 3 Year | 360000 |
428893 |
11.79% |
445127 |
14.38% |
445256 |
14.40% |
| Since Inception | 420000 |
524102 |
12.78% |
550047 |
15.66% |
547427 |
15.38% |
Past performance may or may not be sustained in future. Different Plans i.e. Regular Plan and Direct Plan under the scheme have different expense structure. Benchmark: Nifty 500 TRI Additional Benchmark: Nifty 50 TRI. For SIP returns, monthly investment of Rs.10,000 invested on the 1st business day of every month has been considered. CAGR Returns (%) are computed after accounting for the cash flow by using the XIRR method (investment internal rate of return).
Disclaimer - Fund SIP Performance
The performance details provided herein are of Growth option under Direct and Regular Plans. The Fund(s) offer Systematic Investment Plan (SIP) facility. To illustrate the advantages of SIP investments, this is how your investments would have grown if you had invested say Rs. 10,000 systematically on the first Business Day of every month over a period of time in the Growth Option of respective scheme. The returns are calculated by XIRR approach assuming investment of 10,000/- on the 1st working day of every month. XIRR helps in calculating return on investments given an initial and final value and a series of cash inflows and outflows with correct allowance for the time impact of the transactions.
Record Date |
Plan(s) Option(s) |
Individuals/ HUF (IDCW) (Rs per unit) |
Others (IDCW) (Rs per unit) |
Cum-IDCW NAV (Rs per unit) |
22-Dec-20 |
Regular Plan - IDCW Option |
0.5000 |
0.5000 |
11.4328 |
22-Dec-20 |
Direct Plan - IDCW Option |
0.5000 |
0.5000 |
11.7326 |
Pursuant to payment of IDCW, the NAV of the IDCW Option(s) of the Scheme/Plan(s) falls to the extent of payout and statutory levy, if any. Past performance may or may not be sustained in future and should not be used as a basis for comparison with other investments. For complete list of IDCW, visit www.itiamc.com.
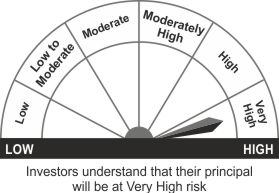
THIS PRODUCT IS SUITABLE FOR INVESTORS WHO ARE SEEKING^
- Capital appreciation over long term
- Investment in equity and equity related securities
^Investors should consult their financial advisers if in doubt about whether the product is suitable for them.
Face Value per Unit: Rs. 10 unless other wise specified; Data is as of April 28, 2023 unless other wise specified.
Mutual Fund investments are subject to market risks, read all scheme related documents carefully