| CATEGORY OF SCHEME | ELSS Fund |
| INVESTMENT OBJECTIVE | To provide long-term capital appreciation by investing predominantly in equity and equity related securities. However, there is no assurance or guarantee that the investment objective of the Scheme will be achieved. The scheme does not assure or guarantee any returns. |
| Inception Date (Date of Allotment): | 18-Oct-19 |
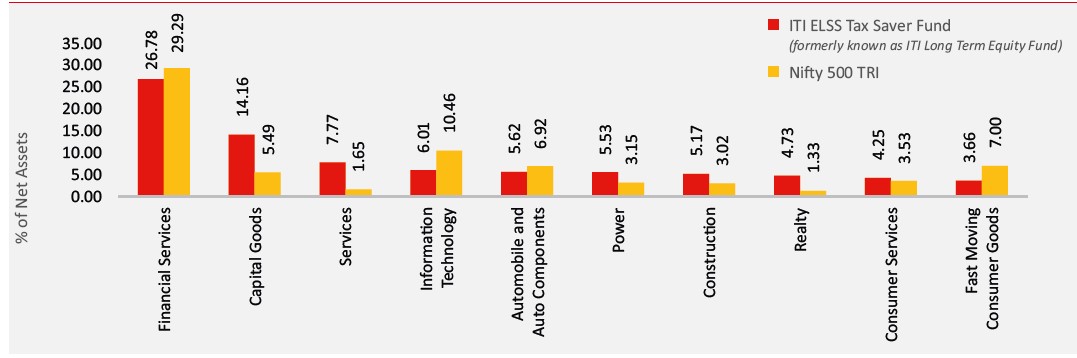
| Benchmark: | Nifty 500 TRI |
| Minimum Application Amount: | Rs. 500/- and in multiples of Rs. 500/- thereafter |
| Load Structure: | Entry Load: Nil Exit Load: Nil |
| Total Expense Ratio (TER): | Including Additional Expenses and Goods and Service
Tax on Management Fees |
| Fund Manager | Mr. Alok Ranjan (Since 04-Nov-24) Total Experience: 25 years Mr. Dhimant Shah (Since 01-Dec-22) Total Experience : 26 years |
| AUM (in Rs. Cr): | 374.22 |
| AAUM (in Rs. Cr): | 377.28 |
| % of top 5 holdings: | 19.15% |
| % of top 10 holdings: | 31.98% |
| No. of scrips: | 70 |
| Standard Deviation^: | 13.91% |
| Beta^: | 0.93 |
| Sharpe Ratio^*: | 0.76 |
| Average P/B | 7.51 |
| Average P/E | 27.12 |
| Portfolio Turnover Ratio | 1.20 |
| ^Computed for the 3-yr period ended January 31, 2025. Based on monthly return. * Risk free rate: 6.65(Source: FIMMDA MIBOR) | |
Regular Plan
(in Rs.) |
Direct Plan
(in Rs.) |
|
| Growth: | 22.2106 |
24.7110 |
| IDCW: | 20.3820 |
22.7866 |
Name of the Instrument |
% to
NAV |
% to NAV
Derivatives |
|
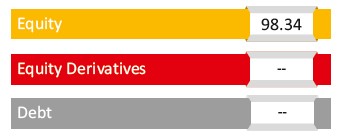
Equity & Equity Related Total |
98.34 |
||
Automobile and Auto Components |
5.62 |
||
TVS Motor Company Limited |
2.84 |
||
Mahindra & Mahindra Limited |
1.87 |
||
Sansera Engineering Limited |
0.91 |
||
Capital Goods |
14.16 |
||
Welspun Corp Limited |
2.43 |
||
KEI Industries Limited |
1.89 |
||
CG Power and Industrial Solutions Limited |
1.86 |
||
Bharat Bijlee Limited |
1.34 |
||
Usha Martin Limited |
1.32 |
||
Tega Industries Limited |
1.24 |
||
Standard Glass Lining Technology Ltd |
1.03 |
||
Hariom Pipe Industries Ltd |
0.74 |
||
Supreme Industries Limited |
0.61 |
||
Finolex Industries Limited |
0.58 |
||
Siemens Limited |
0.49 |
||
Cummins India Limited |
0.47 |
||
Sanghvi Movers Limited |
0.17 |
||
Chemicals |
1.95 |
||
Supreme Petrochem Limited |
1.50 |
||
Vishnu Chemicals Limited |
0.46 |
||
Construction |
5.17 |
||
NBCC (India) Limited |
1.71 |
||
Engineers India Limited |
1.25 |
||
Larsen & Toubro Limited |
1.23 |
||
KEC International Limited |
0.97 |
||
Consumer Durables |
1.57 |
||
PG Electroplast Limited |
1.07 |
||
Kalyan Jewellers India Limited |
0.50 |
||
Consumer Services |
4.25 |
||
Trent Limited |
2.72 |
||
Zomato Limited |
0.84 |
||
Juniper Hotels Limited |
0.59 |
||
ITC Hotels Limited |
0.11 |
||
Fast Moving Consumer Goods |
3.66 |
||
Bikaji Foods International Limited |
1.12 |
||
ITC Limited |
1.02 |
||
Jyothy Labs Limited |
0.83 |
||
Allied Blenders And Distillers Limited |
0.70 |
||
Financial Services |
26.78 |
||
HDFC Bank Limited |
6.32 |
||
Axis Bank Limited |
2.97 |
||
Cholamandalam Investment and Finance Company Ltd |
2.65 |
||
State Bank of India |
2.55 |
||
Bajaj Finance Limited |
2.49 |
||
Jana Small Finance Bank Limited |
1.99 |
||
ICICI Bank Limited |
1.59 |
||
PNB Housing Finance Limited |
1.52 |
||
Housing & Urban Development Corporation Limited |
1.05 |
||
DAM Capital Advisors Limited |
1.02 |
||
Home First Finance Company India Limited |
1.01 |
||
Karur Vysya Bank Limited |
0.87 |
||
One 97 Communications Limited |
0.76 |
||
Forest Materials |
3.64 |
||
Aditya Birla Real Estate Limited |
3.64 |
||
Healthcare |
2.53 |
||
Supriya Lifescience Limited |
1.76 |
||
Sequent Scientific Limited |
0.77 |
||
Information Technology |
6.01 |
||
Zaggle Prepaid Ocean Services Limited |
2.04 |
||
Tata Consultancy Services Limited |
1.36 |
||
Zensar Technologies Limited |
1.16 |
||
KPIT Technologies Limited |
1.14 |
||
Tech Mahindra Limited |
0.30 |
||
Oil Gas & Consumable Fuels |
1.00 |
||
Hindustan Petroleum Corporation Limited |
1.00 |
||
Power |
5.53 |
||
NTPC Limited |
1.74 |
||
KPI Green Energy Limited |
1.72 |
||
Tata Power Company Limited |
1.28 |
||
Adani Energy Solutions Limited |
0.80 |
||
Realty |
4.73 |
||
Sobha Limited |
2.33 |
||
Godrej Properties Limited |
1.44 |
||
Anant Raj Limited |
0.96 |
||
Services |
7.77 |
||
InterGlobe Aviation Limited |
3.38 |
||
eClerx Services Limited |
1.85 |
||
CMS Info System Limited |
0.92 |
||
Dredging Corporation of India Limited |
0.88 |
||
JSW Infrastructure Ltd |
0.75 |
||
Telecommunication |
2.67 |
||
Bharti Airtel Limited |
1.60 |
||
Indus Towers Limited |
1.06 |
||
Textiles |
1.28 |
||
Arvind Limited |
0.90 |
||
Nitin Spinners Limited |
0.38 |
||
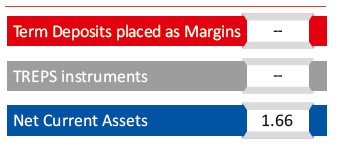
Short Term Debt & Net Current Assets |
1.66 |
Top Ten Holdings
Value of Investment of 10,000 |
||||||
| Period | Fund Returns (%) |
Benchmark Returns (%) |
Additional Benchmark Returns (%) |
Fund () |
Benchmark () |
Additional Benchmark () |
Regular - Growth |
||||||
| Last 1 Year | 9.64% |
10.03% |
9.55% |
10,967 |
11,006 |
10,958 |
| Last 3 Years | 17.21% |
14.24% |
12.01% |
16,109 |
14,916 |
14,058 |
| Last 5 Years | 15.60% |
18.16% |
15.80% |
20,659 |
23,054 |
20,844 |
| Since Inception | 16.27% |
18.00% |
15.46% |
22,211 |
24,012 |
21,404 |
Direct - Growth |
||||||
| Last 1 Year | 11.63% |
10.03% |
9.55% |
11,166 |
11,006 |
10,958 |
| Last 3 Years | 19.45% |
14.24% |
12.01% |
17,052 |
14,916 |
14,058 |
| Last 5 Years | 17.94% |
18.16% |
15.80% |
22,842 |
23,054 |
20,844 |
| Since Inception | 18.64% |
18.00% |
15.46% |
24,711 |
24,012 |
21,404 |
Past performance may or may not be sustained in future and is not a guarantee of any future returns, and should not be used as a basis of comparison with other investments. In case, the start / end date of the concerned period is a non-business date (NBD), the NAV of the previous date is considered for computation of returns. Different Plans i.e. Regular Plan and Direct Plan under the scheme have different expense structure. Benchmark: Nifty 500 TRI Additional Benchmark: Nifty 50 TRI. Fund Managers: Mr. Alok Ranjan (Since 04-Nov-24) and Mr. Dhimant Shah (Since 01-Dec-22). Inception date of the scheme (18-Oct-19). Face Value per unit: 10 ITI ELSS Tax Saver Fund NAV as on January 31, 2025: Rs. 22.2106 (Regular Growth Option), Rs. 24.7110 (Direct Growth Option)
| Period | Amount Invested |
Fund Returns (%) |
Benchmark Returns (%) |
Additional Benchmark Returns (%) |
Fund Value () |
Benchmark Value () |
Additional Benchmark Value () |
Regular - Growth |
|||||||
| Last 1 Year |
1,20,000 |
-8.28% |
-3.04% |
0.02% |
1,14,555 |
1,18,021 |
1,20,014 |
| Last 3 Year |
3,60,000 |
19.74% |
16.21% |
13.37% |
4,81,205 |
4,57,805 |
4,39,534 |
| Last 5 Year |
6,00,000 |
18.71% |
18.86% |
16.14% |
9,56,947 |
9,60,319 |
8,98,551 |
| Since Inception |
6,40,000 |
18.23% |
18.62% |
15.93% |
10,41,333 |
10,52,114 |
9,80,276 |
Direct - Growth |
|||||||
| Last 1 Year |
1,20,000 |
-6.55% |
-3.04% |
0.02% |
1,15,705 |
1,18,021 |
1,20,014 |
| Last 3 Year |
3,60,000 |
22.02% |
16.21% |
13.37% |
4,96,750 |
4,57,805 |
4,39,534 |
| Last 5 Year |
6,00,000 |
21.06% |
18.86% |
16.14% |
10,13,185 |
9,60,319 |
8,98,551 |
| Since Inception |
6,40,000 |
20.56% |
18.62% |
15.93% |
11,06,832 |
10,52,114 |
9,80,276 |
Past performance may or may not be sustained in future and is not a guarantee of any future returns, and should not be used as a basis of comparison with other investments. Different Plans i.e. Regular Plan and Direct Plan under the scheme have different expense structure. Benchmark: Nifty 500 TRI Additional Benchmark: Nifty 50 TRI. For SIP returns, monthly investment of Rs.10,000 invested on the 1st business day of every month has been considered. CAGR Returns (%) are computed after accounting for the cash flow by using the XIRR method (investment internal rate of return).
Disclaimer - Fund SIP Performance
The performance details provided herein are of Growth option under Direct and Regular Plans. The Fund(s) offer Systematic Investment Plan (SIP) facility. To illustrate the advantages of SIP investments, this is how your investments would have grown if you had invested say Rs. 10,000 systematically on the first Business Day of every month over a period of time in the Growth Option of respective scheme. The returns are calculated by XIRR approach assuming investment of 10,000/- on the 1st working day of every month. XIRR helps in calculating return on investments given an initial and final value and a series of cash inflows and outflows with correct allowance for the time impact of the transactions.
Record Date |
Plan(s) Option(s) |
Individuals/ HUF (IDCW) (Rs per unit) |
Others (IDCW) (Rs per unit) |
Cum-IDCW NAV (Rs per unit) |
22-Dec-20 |
Regular Plan - Dividend Option |
0.5000 |
0.5000 |
11.4328 |
22-Dec-20 |
Direct Plan - Dividend Option |
0.5000 |
0.5000 |
11.7326 |
Pursuant to payment of IDCW, the NAV of the IDCW Option(s) of the Scheme/Plan(s) falls to the extent of payout and statutory levy, if any. Past performance may or may not be sustained in future and should not be used as a basis for comparison with other investments. For complete list of IDCW, visit www.itiamc.com.
THIS PRODUCT IS SUITABLE FOR INVESTORS WHO ARE SEEKING^
- Capital appreciation over long term
- Investment in equity and equity related securities
^Investors should consult their financial advisers if in doubt about whether the product is suitable for them.
Face Value per Unit: Rs. 10 unless other wise specified; Data is as of January 31, 2025 unless other wise specified.
(*ITI Long Term Equity Fund name has been changed to ITI ELSS Tax Saver Fund with effect from October 30, 2023.)
Mutual Fund investments are subject to market risks, read all scheme related documents carefully