| CATEGORY OF SCHEME | Sectoral/ Thematic Fund |
| INVESTMENT OBJECTIVE | The investment objective of the scheme is to generate long-term capital appreciation from a portfolio that is invested predominantly in equity and equity related securities of companies engaged in banking and financial services. However, there can be no assurance that the investment objective of the scheme would be achieved. |
| Inception Date (Date of Allotment): | 06-Dec-21 |
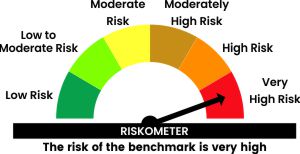
| Benchmark: | Nifty Financial Services TRI |
| Minimum Application Amount: | Rs. 5,000/- and in multiples of Re. 1/- thereafter |
| Load Structure: | Entry Load: Nil Exit Load:1% if redeemed or switched out on or before completion of 12 months from the date of allotment of units · Nil, if redeemed or switched out after completion of 12 months from the date of allotment of units. |
| Total Expense Ratio (TER): | Including Additional Expenses and Goods and Service
Tax on Management Fees |
| Fund Manager | Mr. Nilay Dalal (Since 05 May 2023) |
| AUM (in Rs. Cr): | 265.94 |
| AAUM (in Rs. Cr): | 262.84 |
| % of top 5 holdings: | 58.79% |
| % of top 10 holdings: | 72.54% |
| No of scrips: | 30 |
| Standard Deviation^: | 13.99% |
| Beta^: | 0.92 |
| Sharpe Ratio^*: | 0.20 |
| Average P/B | 4.02 |
| Average P/E | 15.76 |
| Portfolio Beta | NA |
| Portfolio Turnover Ratio | 1.41 |
^Computed for the 3-yr period ended January 31, 2025.
Based on monthly return. *Risk free rate: 6.65 (Source:
FIMMDA MIBOR) (P/E ratio taken on net equity level) |
|
Regular Plan
(in Rs.) |
Direct Plan
(in Rs.) |
|
| Growth: | 13.2212 |
14.1007 |
| IDCW: | 13.2212 |
14.1007 |
Name of the Instrument |
% to
NAV |
% to NAV
Derivatives |
|
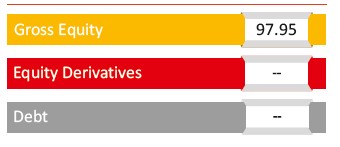
Equity & Equity Related Total |
97.95 |
||
Financial Services |
97.09 |
||
HDFC Bank Limited |
24.47 |
||
ICICI Bank Limited |
14.49 |
||
Kotak Mahindra Bank Limited |
7.30 |
||
State Bank of India |
6.41 |
||
Axis Bank Limited |
6.13 |
||
Bajaj Finance Limited |
5.19 |
||
Bajaj Finserv Limited |
2.43 |
||
Muthoot Finance Limited |
2.19 |
||
ICICI Securities Limited |
1.99 |
||
Cholamandalam Investment and Finance Company Ltd |
1.95 |
||
Mahindra & Mahindra Financial Services Limited |
1.78 |
||
HDFC Life Insurance Company Limited |
1.76 |
||
Power Finance Corporation Limited |
1.68 |
||
L&T Finance Limited |
1.64 |
||
Aditya Birla Capital Limited |
1.62 |
||
Shriram Finance Limited |
1.58 |
||
Karur Vysya Bank Limited |
1.54 |
||
City Union Bank Limited |
1.48 |
||
REC Limited |
1.32 |
||
LIC Housing Finance Limited |
1.24 |
||
Multi Commodity Exchange of India Limited |
1.20 |
||
Housing & Urban Development Corporation Limited |
1.12 |
||
Nuvama Wealth Management Limited |
1.05 |
||
SBI Life Insurance Company Limited |
1.04 |
||
The Federal Bank Limited |
0.99 |
||
India Shelter Finance Corporation Limited |
0.98 |
||
PNB Housing Finance Limited |
0.95 |
||
ICICI Lombard General Insurance Company Limited |
0.91 |
||
Jio Financial Services Limited |
0.68 |
||
Information Technology |
0.86 |
||
Protean eGov Technologies Limited |
0.86 |
||
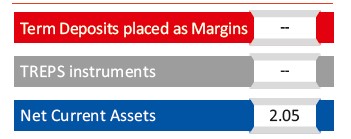
Short Term Debt & Net Current Assets |
2.05 |
Top Ten Holdings
| Period | Fund Returns (%) |
Benchmark Returns (%)
|
Additional Benchmark Returns (%) |
Fund (Rs) |
Benchmark (Rs) |
Additional Benchmark Returns (Rs) |
Regular - Growth |
||||||
| Last 1 Year | 5.65% |
14.38% |
9.55% |
10,566 |
11,443 |
10,958 |
| Last 3 Years | 9.50% |
10.22% |
12.01% |
13,132 |
13,393 |
14,058 |
| Since Inception | 9.25% |
10.17% |
12.30% |
13,221 |
13,576 |
14,422 |
Direct - Growth |
||||||
| Last 1 Year | 7.66% |
14.38% |
9.55% |
10,768 |
11,443 |
10,958 |
| Last 3 Years | 11.74% |
10.22% |
12.01% |
13,956 |
13,393 |
14,058 |
| Since Inception | 11.50% |
10.17% |
12.30% |
14,101 |
13,576 |
14,422 |
Past performance may or may not be sustained in future and is not a guarantee of any future returns, and should not be used as a basis of comparison with other investments. The performance data for 3 years period has not been provided, since scheme is in existence for less than 3 years. In case, the start / end date of the concerned period is a non-business date (NBD), the NAV of the previous date is considered for computation of returns. Different Plans i.e. Regular Plan and Direct Plan under the scheme have different expense structure. Benchmark: Nifty Financial Services TRI Additional Benchmark: Nifty 50 TRI. Fund Managers: Mr. Nilay Dalal (Managing since 05-May-23) and Mr. Rohan Korde (Managing since 29-Apr-22). Inception date of the scheme (06-Dec-21). Face Value per unit: Rs. 10. Since the scheme is in existence for more than 3 years but less than 5 years hence performance data for 5 years and more are not provided.
ITI Banking and Financial Services Fund NAV as on January 31, 2025: Rs. 13.2212 (Regular Growth Option), Rs. 14.1007 (Direct Growth Option)
| Period | Amount Invested |
Fund Returns (%) |
Benchmark Returns (%) |
Additional Benchmark Returns (%) |
Fund Value () |
Benchmark Value () |
Additional Benchmark Value () |
Regular - Growth |
|||||||
| Last 1 Year |
1,20,000 |
-2.50% |
4.91% |
0.02% |
1,18,370 |
1,23,165 |
1,20,014 |
| Last 3 Year |
3,60,000 |
9.75% |
12.13% |
13.39% |
4,16,927 |
4,31,696 |
4,39,652 |
| Since Inception |
3,80,000 |
9.68% |
11.89% |
13.19% |
4,43,196 |
4,58,550 |
4,67,790 |
Direct - Growth |
|||||||
| Last 1 Year |
1,20,000 |
-0.61% |
4.91% |
0.02% |
1,19,603 |
1,23,165 |
1,20,014 |
| Last 3 Year |
3,60,000 |
11.96% |
12.13% |
13.39% |
4,30,613 |
4,31,696 |
4,39,652 |
| Since Inception |
3,80,000 |
11.89% |
11.89% |
13.19% |
4,58,597 |
4,58,550 |
4,67,790 |
Past performance may or may not be sustained in future and is not a guarantee of any future returns, and should not be used as a basis of comparison with other investments. Different Plans i.e. Regular Plan and Direct Plan under the scheme have different expense structure. Benchmark: Nifty Financial Services TRI Additional Benchmark: Nifty 50 TRI. For SIP returns, monthly investment of Rs.10,000 invested on the 1st business day of every month has been considered. CAGR Returns (%) are computed after accounting for the cash flow by using the XIRR method (investment internal rate of return).
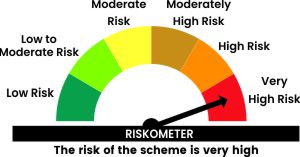
THIS PRODUCT IS SUITABLE FOR INVESTORS WHO ARE SEEKING^
- Capital appreciation over long term
- Investments in equity and equity related securities of companies engaged in banking and financial services
^Investors should consult their financial advisers if in doubt about whether the product is suitable for them.
Face Value per Unit: Rs. 10 unless other wise specified; Data is as of January 31, 2025 unless other wise specified.
Mutual Fund investments are subject to market risks, read all scheme related documents carefully