| CATEGORY OF SCHEME | SMALL CAP FUND |
| INVESTMENT OBJECTIVE | The investment objective of the Scheme is to generate capital appreciation by predominantly investing in equity and equity related securities of small cap companies. However, there can be no assurance that the investment objective of the scheme would be achieved. |
| Inception Date (Date of Allotment): | 17-Feb-20 |
| Benchmark: | Nifty Smallcap 250 TRI |
| Minimum Application Amount: | Rs. 5,000/- and in multiples of Rs. 1/- thereafter |
| Load Structure: | Entry Load: Nil Exit Load: If units are redeemed /switched out within 12 months - 1%. Nil thereafter |
| Total Expense Ratio (TER): | Including Additional Expenses and Goods and Service
Tax on Management Fees |
| Fund Manager | Mr. Dhimant Shah (Since 08 August 2022) Total Experience : 26 years Mr. Rohan Korde (Since 01 December 2022) Total Experience: 19 years |
| AUM (in Rs. Cr): | 1763.84 |
| AAUM (in Rs. Cr): | 1871.14 |
| % of top 5 holdings: | 11.83% |
| % of top 10 holdings: | 21.07% |
| No. of scrips: | 82 |
| Standard Deviation^: | 16.35% |
| Beta^: | 0.88 |
| Sharpe Ratio^*: | 1.00 |
| Average P/B | 8.28 |
| Average P/E | 51.33 |
| Portfolio Turnover Ratio | 1.27 |
| ^Computed for the 3-yr period ended February 29,
2024. Based on daily NAV. * Risk free rate: 6.80 (Source: FIMMDA MIBOR) |
|
Regular Plan
(in Rs.) |
Direct Plan
(in Rs.) |
|
| Growth: | 23.0843 |
25.0699 |
| IDCW: | 23.0843 |
25.0699 |
Name of the Instrument |
% to
NAV |
% to NAV
Derivatives |
|
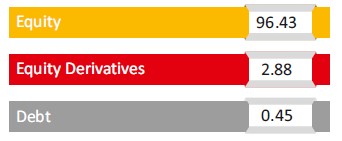
Equity & Equity Related Total |
96.43 |
2.88 |
|
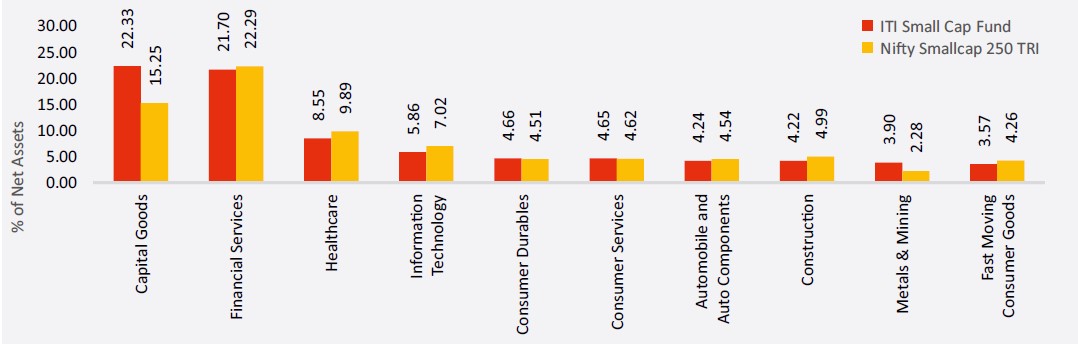
Automobile and Auto Components |
4.24 |
||
Exide Industries Limited |
1.38 |
||
Maruti Suzuki India Limited |
1.02 |
||
MRF Limited |
1.01 |
||
ZF Commercial Vehicle Control Systems India Limited |
0.83 |
||
Capital Goods |
22.33 |
||
Kirloskar Oil Engines Limited |
2.14 |
||
Inox Wind Limited |
2.13 |
||
Bharat Dynamics Limited |
1.93 |
||
Hi-Tech Pipes Limited |
1.85 |
||
Kaynes Technology India Limited |
1.39 |
||
Ingersoll Rand (India) Limited |
1.35 |
||
Jyoti CNC Automation Ltd |
1.29 |
||
KSB Limited |
1.29 |
||
Apar Industries Limited |
1.28 |
||
Titagarh Rail Systems Limited |
1.26 |
||
Welspun Corp Limited |
1.24 |
||
Kirloskar Pneumatic Company Limited |
1.19 |
||
Suzlon Energy Limited |
1.11 |
||
Mazagon Dock Shipbuilders Limited |
1.08 |
||
Praj Industries Limited |
1.01 |
||
Timken India Limited |
0.78 |
||
Chemicals |
2.19 |
||
Solar Industries India Limited |
1.18 |
||
Sumitomo Chemical India Limited |
1.01 |
||
Construction |
4.22 |
||
NCC Limited |
2.65 |
||
PNC Infratech Limited |
1.56 |
||
Construction Materials |
2.16 |
||
JK Cement Limited |
1.19 |
||
Dalmia Bharat Limited |
0.97 |
||
Consumer Durables |
4.66 |
||
Blue Star Limited |
1.21 |
||
Dixon Technologies (India) Limited |
0.96 |
||
PG Electroplast Limited |
0.89 |
||
Century Plyboards (India) Limited |
0.87 |
||
Mayur Uniquoters Limited |
0.73 |
||
Consumer Services |
4.65 |
||
Zomato Limited |
1.44 |
||
Wonderla Holidays Limited |
1.29 |
||
Taj GVK Hotels & Resorts Limited |
1.21 |
||
Credo Brands Marketing Limited |
0.50 |
||
Westlife Foodworld Limited |
0.20 |
||
Fast Moving Consumer Goods |
3.57 |
||
Radico Khaitan Limited |
1.24 |
||
Tata Consumer Products Limited |
1.24 |
||
ITC Limited |
1.09 |
||
Financial Services |
19.87 |
1.82 |
|
BSE Limited |
1.57 |
||
Canara Bank |
1.41 |
||
Union Bank of India |
1.28 |
||
Central Depository Services (India) Limited |
1.27 |
||
Bank of Maharashtra |
1.17 |
||
IDFC Limited |
1.13 |
||
Karur Vysya Bank Limited |
1.10 |
||
Bank of India |
1.09 |
||
The Jammu & Kashmir Bank Limited |
1.07 |
||
IndusInd Bank Limited |
1.02 |
||
Computer Age Management Services Limited |
1.00 |
||
Share India Securities Limited |
0.99 |
||
DCB Bank Limited |
0.98 |
||
The Karnataka Bank Limited |
0.97 |
||
CreditAccess Grameen Limited |
0.95 |
||
Home First Finance Company India Limited |
0.82 |
||
Indiabulls Housing Finance Limited |
0.62 |
||
REC Limited |
0.57 |
0.96 |
|
CSB Bank Limited |
0.52 |
||
RBL Bank Limited |
0.34 |
0.87 |
|
Forest Materials |
1.04 |
||
Century Textiles & Industries Limited |
1.04 |
||
Healthcare |
8.55 |
||
Sun Pharmaceutical Industries Limited |
1.50 |
||
JB Chemicals & Pharmaceuticals Limited |
1.49 |
||
Global Health Limited |
1.38 |
||
Mankind Pharma Limited |
1.15 |
||
Aster DM Healthcare Limited |
1.13 |
||
Suven Pharmaceuticals Limited |
1.05 |
||
Ami Organics Limited |
0.86 |
||
Information Technology |
5.86 |
||
KPIT Technologies Limited |
2.06 |
||
Cyient Limited |
2.05 |
||
Birlasoft Limited |
1.74 |
||
Metals & Mining |
2.84 |
1.06 |
|
Jindal Stainless Limited |
2.84 |
||
Tata Steel Limited |
1.06 |
||
Miscellaneous |
0.99 |
||
Exicom Tele-Systems Ltd |
0.99 |
||
Power |
2.06 |
||
KPI Green Energy Limited |
1.26 |
||
NLC India Limited |
0.80 |
||
Realty |
2.61 |
||
Brigade Enterprises Limited |
1.67 |
||
Swan Energy Limited |
0.94 |
||
Services |
0.82 |
||
VRL Logistics Limited |
0.82 |
||
Telecommunication |
1.79 |
||
Route Mobile Limited |
1.02 |
||
Indus Towers Limited |
0.77 |
||
Textiles |
1.99 |
||
Arvind Limited |
1.30 |
||
Raymond Limited |
0.69 |
||
Mutual Fund Units |
0.45 |
||
ITI Dynamic Bond Fund -Direct Plan -Growth Option |
0.26 |
||
ITI Banking & PSU Debt Fund -Direct Plan -Growth Option |
0.19 |
||
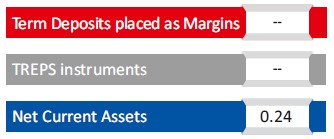
Short Term Debt & Net Current Assets |
0.24 |
Top Ten Holdings
Value of Investment of 10,000 |
||||||
| Period | Fund Returns (%) |
Benchmark Returns (%) |
Additional Benchmark Returns (%) |
Fund () |
Benchmark () |
Additional Benchmark () |
Regular - Growth |
||||||
| Last 1 Year | 64.5% |
68.6% |
28.4% |
16,474 |
16,880 |
12,849 |
| Last 3 Years | 23.0% |
30.5% |
16.1% |
18,640 |
22,264 |
15,675 |
| Since Inception | 23.0% |
31.5% |
17.4% |
23,084 |
30,212 |
19,135 |
Direct - Growth |
||||||
| Last 1 Year | 67.4% |
68.6% |
28.4% |
16,765 |
16,880 |
12,849 |
| Last 3 Years | 25.5% |
30.5% |
16.1% |
19,792 |
22,264 |
15,675 |
| Since Inception | 25.6% |
31.5% |
17.4% |
25,070 |
30,212 |
19,135 |
Past performance may or may not be sustained in future and is not a guarantee of any future returns, and should not be used as a basis of comparison with other investments. The performance data for 5 years period has not been provided, since scheme is in existence for less than 5 years. In case, the start / end date of the concerned period is a non-business date (NBD), the NAV of the previous date is considered for computation of returns. Different Plans i.e. Regular Plan and Direct Plan under the scheme have different expense structure. Benchmark: Nifty Small Cap 250 TRI Additional Benchmark: Nifty 50 TRI. Fund Managers: Mr. Dhimant Shah (Managing since 08-August-2022) and Mr. Rohan Korde (Managing since 01-December-2022). Inception date of the scheme (Since 17-Feb-20). Face Value per unit: Rs. 10. ITI Small Cap Fund NAV as on Feb 29, 2024: Rs. 23.0843 (Regular Growth Option), Rs. 25.0699 (Direct Growth Option)
| Period | Amount Invested |
Fund Value () |
Fund Returns (%) |
Benchmark Value () |
Benchmark Returns (%) |
Additional Benchmark Value () |
Additional Benchmark Returns (%) |
Regular - Growth |
|||||||
| Last 1 Year |
1,20,000 |
1,59,319 |
66.14% |
1,60,973 |
69.12% |
1,37,805 |
28.73% |
| Last 3 Years |
3,60,000 |
5,52,239 |
29.91% |
5,74,562 |
32.90% |
4,59,773 |
16.58% |
| Since Inception |
4,80,000 |
8,66,803 |
30.60% |
9,85,632 |
37.72% |
7,08,626 |
19.79% |
Direct - Growth |
|||||||
| Last 1 Year |
1,20,000 |
1,60,955 |
69.09% |
1,60,973 |
69.12% |
1,37,805 |
28.73% |
| Last 3 Years |
3,60,000 |
5,69,378 |
32.21% |
5,74,562 |
32.90% |
4,59,773 |
16.58% |
| Since Inception |
4,80,000 |
9,07,566 |
33.13% |
9,85,632 |
37.72% |
7,08,626 |
19.79% |
Past performance may or may not be sustained in future and is not a guarantee of any future returns, and should not be used as a basis of comparison with other investments. Different Plans i.e. Regular Plan and Direct Plan under the scheme have different expense structure. Benchmark: Nifty Smallcap 250 TRI Additional Benchmark: Nifty 50 TRI. For SIP returns, monthly investment of Rs.10,000 invested on the 1st business day of every month has been considered. CAGR Returns (%) are computed after accounting for the cash flow by using the XIRR method (investment internal rate of return).
Disclaimer - Fund SIP Performance
The performance details provided herein are of Growth option under Direct and Regular Plans. The Fund(s) offer Systematic Investment Plan (SIP) facility. To illustrate the advantages of SIP investments, this is how your investments would have grown if you had invested say Rs. 10,000 systematically on the first Business Day of every month over a period of time in the Growth Option of respective scheme. The returns are calculated by XIRR approach assuming investment of 10,000/- on the 1st working day of every month. XIRR helps in calculating return on investments given an initial and final value and a series of cash inflows and outflows with correct allowance for the time impact of the transactions.
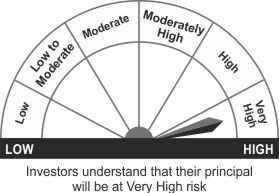
THIS PRODUCT IS SUITABLE FOR INVESTORS WHO ARE SEEKING^
- Capital appreciation over long term
- Investment in a diversified Portfolio predominantly consists of equity and equity related instruments of small cap companies
^Investors should consult their financial advisers if in doubt about whether the product is suitable for them.
Face Value per Unit: Rs. 10 unless other wise specified; Data is as of February 29, 2024 unless other wise specified.
Mutual Fund investments are subject to market risks, read all scheme related documents carefully