| CATEGORY OF SCHEME | Multicap Fund |
| INVESTMENT OBJECTIVE | The investment objective of the Scheme is to generate long-term capital appreciation from a diversified portfolio that predominantly invests in equity and equity-related securities of companies across various market capitalisation. However, there can be no assurance that the investment objective of the Scheme will be realised. |
| Inception Date (Date of Allotment): | 15-May-19 |
| Benchmark: | Nifty 500 Multicap 50:25:25 TRI |
| Minimum Application Amount: | Rs.1,000/- and in multiples of Rs. 1/- thereafter |
| Load Structure: | Entry Load: Nil Exit Load: 1% if redeemed or switched out on or before completion of 3 months from the date of allotment of units · Nil, if redeemed or switched out after completion of 3 months from the date of allotment of units. |
| Total Expense Ratio (TER): | Including Additional Expenses and Goods and Service
Tax on Management Fees |
| Fund Manager | Mr. Dhimant Shah (Since 08-Aug-22) Total Experience : 26 years Mr. Rohan Korde (Since 01-Dec-22) Total Experience: 17 years |
| AUM (in Rs. Cr): | 1,022.05 |
| AAUM (in Rs. Cr): | 1,213.42 |
| % of top 5 holdings: | 17.28% |
| % of top 10 holdings: | 28.49% |
| No. of scrips: | 66 |
| Standard Deviation^: | 14.98% |
| Beta^: | 0.99 |
| Sharpe Ratio^*: | 0.55 |
| Average P/B | 8.41 |
| Average P/E | 27.42 |
| Portfolio Turnover Ratio | 0.99 |
| ^Computed for the 3-yr period ended February 28, 2025. Based on monthly return. *Risk free rate: 6.40 (Source: FIMMDA MIBOR) | |
Regular Plan
(in Rs.) |
Direct Plan
(in Rs.) |
|
| Growth: | 19.3909 |
21.7793 |
| IDCW: | 17.7758 |
20.0703 |
Name of the Instrument |
% to
NAV |
% to NAV
Derivatives |
|
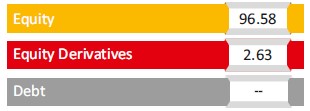
Equity & Equity Related Total |
96.58 |
2.63 |
|
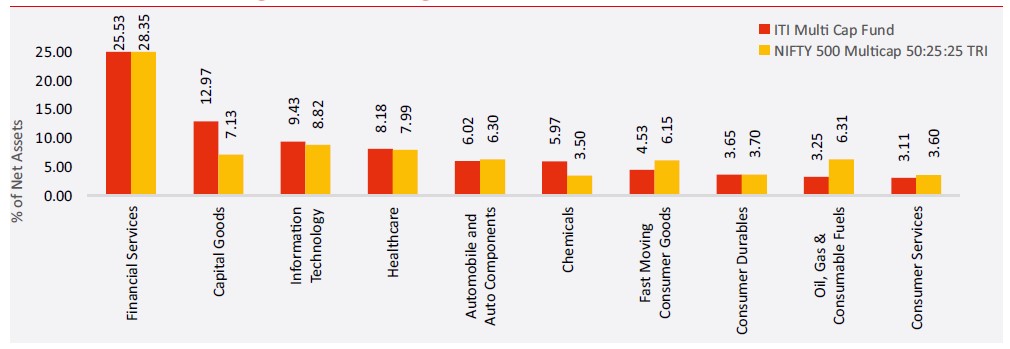
Automobile and Auto Components |
6.02 |
||
Mahindra & Mahindra Limited |
1.47 |
||
ZF Commercial Vehicle Control Systems India Limited |
1.23 |
||
TVS Motor Company Limited |
1.21 |
||
FIEM Industries Limited |
1.18 |
||
Maruti Suzuki India Limited |
0.92 |
||
Capital Goods |
12.19 |
0.78 |
|
Hitachi Energy India Limited |
1.92 |
||
AIA Engineering Limited |
1.55 |
||
Transrail Lighting Limited |
1.45 |
||
Inox Wind Limited |
1.23 |
||
Paras Defence and Space Technologies Limited |
1.07 |
||
Bharat Dynamics Limited |
1.07 |
||
PTC Industries Limited |
1.06 |
||
Triveni Turbine Limited |
0.97 |
||
Jyoti CNC Automation Ltd |
0.97 |
||
ABB India Limited |
0.90 |
||
Polycab India Limited |
0.78 |
||
Chemicals |
5.97 |
||
Solar Industries India Limited |
2.10 |
||
Vishnu Chemicals Limited |
1.45 |
||
UPL Limited |
1.29 |
||
Epigral Limited |
1.12 |
||
Construction |
3.04 |
||
Larsen & Toubro Limited |
1.92 |
||
Techno Electric & Engineering Company Limited |
1.12 |
||
Construction Materials |
2.28 |
||
Ambuja Cements Limited |
1.17 |
||
UltraTech Cement Limited |
1.12 |
||
Consumer Durables |
3.65 |
||
Dixon Technologies (India) Limited |
1.61 |
||
Titan Company Limited |
1.11 |
||
Cera Sanitaryware Limited |
0.93 |
||
Consumer Services |
3.11 |
||
Zomato Limited |
1.63 |
||
The Indian Hotels Company Limited |
1.48 |
||
Fast Moving Consumer Goods |
4.53 |
||
ITC Limited |
2.50 |
||
Hindustan Foods Limited |
1.01 |
||
Triveni Engineering & Industries Limited |
1.01 |
||
Financial Services |
23.97 |
1.55 |
|
HDFC Bank Limited |
5.10 |
||
ICICI Bank Limited |
3.81 |
||
Bajaj Finserv Limited |
1.58 |
||
Multi Commodity Exchange of India Limited |
1.56 |
0.51 |
|
Axis Bank Limited |
1.55 |
||
Max Financial Services Limited |
1.44 |
||
Shriram Finance Limited |
1.40 |
||
One 97 Communications Limited |
1.35 |
1.05 |
|
State Bank of India |
1.29 |
||
Karur Vysya Bank Limited |
1.19 |
||
Aditya Birla Sun Life AMC Limited |
1.17 |
||
Power Finance Corporation Limited |
1.16 |
||
Kotak Mahindra Bank Limited |
0.77 |
||
Manappuram Finance Limited |
0.59 |
||
Healthcare |
8.18 |
||
Lupin Limited |
2.32 |
||
Wockhardt Limited |
1.63 |
||
Mankind Pharma Limited |
1.58 |
||
Sun Pharmaceutical Industries Limited |
1.48 |
||
Apollo Hospitals Enterprise Limited |
1.17 |
||
Information Technology |
9.43 |
||
Infosys Limited |
2.62 |
||
Tata Consultancy Services Limited |
1.73 |
||
KPIT Technologies Limited |
1.59 |
||
Zaggle Prepaid Ocean Services Limited |
1.27 |
||
Oracle Financial Services Software Limited |
1.21 |
||
LTIMindtree Limited |
0.99 |
||
Metals & Mining |
2.00 |
0.29 |
|
Jindal Stainless Limited |
1.31 |
||
Vedanta Limited |
0.69 |
0.29 |
|
Oil Gas & Consumable Fuels |
3.25 |
||
Reliance Industries Limited |
3.25 |
||
Power |
1.56 |
||
NTPC Limited |
1.56 |
||
Realty |
2.62 |
||
Godrej Properties Limited |
1.52 |
||
Sobha Limited |
1.10 |
||
Telecommunication |
2.32 |
||
Bharti Airtel Limited |
2.32 |
||
Textiles |
2.47 |
||
Page Industries Limited |
1.42 |
||
Indo Count Industries Limited |
1.05 |
||
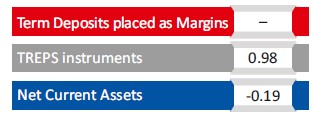
Short Term Debt & Net Current Assets |
0.79 |
Top Ten Holdings
Value of Investment of 10,000 |
||||||
| Period | Fund Returns (%) |
Benchmark Returns (%) |
Additional Benchmark Returns (%) |
Fund () |
Benchmark () |
Additional Benchmark () |
Regular - Growth |
||||||
Last 1 Year |
-6.86% |
-1.03% |
1.89% |
9,314 |
9,897 |
10,189 |
Last 3 Years |
14.63% |
14.69% |
10.92% |
15,069 |
15,094 |
13,652 |
Last 5 Years |
12.85% |
20.31% |
15.94% |
18,312 |
25,229 |
20,966 |
Since Inception |
12.10% |
17.64% |
13.91% |
19,391 |
25,642 |
21,272 |
Direct - Growth |
||||||
Last 1 Year |
-5.32% |
-1.03% |
1.89% |
9,468 |
9,897 |
10,189 |
| Last 3 Years | 16.80% |
14.69% |
10.92% |
15,942 |
15,094 |
13,652 |
Last 5 Years |
15.11% |
20.31% |
15.94% |
20,228 |
25,229 |
20,966 |
Since Inception |
14.37% |
17.64% |
13.91% |
21,779 |
25,642 |
21,272 |
Past performance may or may not be sustained in future and is not a guarantee of any future returns, and should not be used as a basis of comparison with other investments. The performance data for 5 years period has not been provided, since scheme is in existence for less than 5 years. In case, the start / end date of the concerned period is a non-business date (NBD), the NAV of the previous date is considered for computation of returns. Different Plans i.e. Regular Plan and Direct Plan under the scheme have different expense structure. Benchmark: Nifty 500 Multicap 50:25:25 TRI Additional Benchmark: Nifty 50 TRI. Fund Managers: Mr. Dhimant Shah (Managing since 08-August-2022) and Mr. Rohan Korde (Managing Since 01-December-2022) Inception date of the scheme (15-May-19). Face Value per unit: Rs. 10 ITI Multi Cap Fund NAV as on February 28, 2025: Rs. 19.3909 (Regular Growth Option), Rs. 21.7793 (Direct Growth Option)
| Period | Amount Invested |
Fund Returns (%) |
Benchmark Returns (%) |
Additional Benchmark Returns (%) |
Fund Value () |
Benchmark Value () |
Additional Benchmark Value () |
Regular - Growth |
|||||||
Last 1 Year |
1,20,000 |
-28.77% |
-20.76% |
-11.93% |
1,00,619 |
1,06,233 |
1,12,215 |
| Last 3 Years | 3,60,000 |
10.05% |
11.50% |
8.74% |
4,18,521 |
4,27,432 |
4,10,521 |
Last 5 Years |
6,00,000 |
12.79% |
17.40% |
13.16% |
8,26,486 |
9,25,694 |
8,34,267 |
Since Inception |
7,00,000 |
12.45% |
17.71% |
13.40% |
10,09,321 |
11,76,220 |
10,37,700 |
Direct - Growth |
|||||||
Last 1 Year |
1,20,000 |
-27.49% |
-20.76% |
-11.93% |
1,01,530 |
1,06,233 |
1,12,215 |
| Last 3 Years | 3,60,000 |
12.18% |
11.50% |
8.74% |
4,31,653 |
4,27,432 |
4,10,521 |
Last 5 Years |
6,00,000 |
15.05% |
17.40% |
13.16% |
8,74,001 |
9,25,694 |
8,34,267 |
Since Inception |
7,00,000 |
14.71% |
17.71% |
13.40% |
10,77,937 |
11,76,220 |
10,37,700 |
Past performance may or may not be sustained in future and is not a guarantee of any future returns, and should not be used as a basis of comparison with other investments. Different Plans i.e. Regular Plan and Direct Plan under the scheme have different expense structure. Benchmark: Nifty 500 Multicap 50:25:25 TRI Additional Benchmark: Nifty 500 Multicap 50:25:25 TRI from Nifty 500 TRI. For SIP returns, monthly investment of Rs.10,000 invested on the 1st business day of every month has been considered. CAGR Returns (%) are computed after accounting for the cash flow by using the XIRR method (investment internal rate of return).
Disclaimer - Fund SIP Performance
The performance details provided herein are of Growth option under Direct and Regular Plans. The Fund(s) offer Systematic Investment Plan (SIP) facility. To illustrate the advantages of SIP investments, this is how your investments would have grown if you had invested say Rs. 10,000 systematically on the first Business Day of every month over a period of time in the Growth Option of respective scheme. The returns are calculated by XIRR approach assuming investment of 10,000/- on the 1st working day of every month. XIRR helps in calculating return on investments given an initial and final value and a series of cash inflows and outflows with correct allowance for the time impact of the transactions.
Record Date |
Plan(s) Option(s) |
Individuals/ HUF (IDCW) (Rs per unit) |
Others (IDCW) (Rs per unit) |
Cum-IDCW NAV (Rs per unit) |
22-Dec-20 |
Regular Plan - IDCW Option |
0.5000 |
0.5000 |
11.1650 |
22-Dec-20 |
Direct Plan - IDCW Option |
0.5000 |
0.5000 |
11.5566 |
07-Mar-24 |
Regular Plan - IDCW Option |
0.80 |
0.80 |
20.0562 |
07-Mar-24 |
Direct Plan - IDCW Option |
0.80 |
0.80 |
22.1924 |
Pursuant to payment of IDCW, the NAV of the IDCW Option(s) of the Scheme/Plan(s) falls to the extent of payout and statutory levy, if any. Past performance may or may not be sustained in future and should not be used as a basis for comparison with other investments. For complete list of IDCW, visit www.itiamc.com.
THIS PRODUCT IS SUITABLE FOR INVESTORS WHO ARE SEEKING^
- Long-term capital growth
- Investment in equity and equity-related securities of companies across various market capitalization
^Investors should consult their financial advisers if in doubt about whether the product is suitable for them.


Face Value per Unit: Rs. 10 unless other wise specified; Data is as of February 28, 2025 unless other wise specified.
Mutual Fund investments are subject to market risks, read all scheme related documents carefully