| CATEGORY OF SCHEME | SMALL CAP FUND |
| INVESTMENT OBJECTIVE | The investment objective of the Scheme is to generate capital appreciation by predominantly investing in equity and equity related securities of small cap companies. However, there can be no assurance that the investment objective of the scheme would be achieved. |
| Inception Date (Date of Allotment): | 17-Feb-20 |
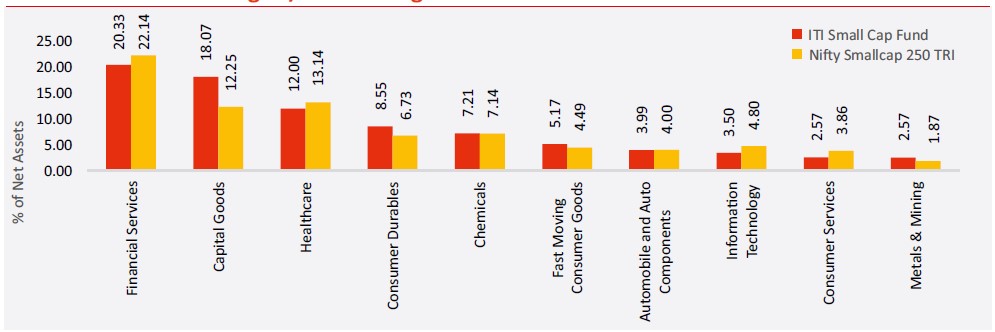
| Benchmark: | Nifty Smallcap 250 TRI |
| Minimum Application Amount: | Rs. 5,000/- and in multiples of Rs. 1/- thereafter |
| Load Structure: | Entry Load: Nil Exit Load: If units are redeemed /switched out within 12 months - 1%. Nil thereafter |
| Total Expense Ratio (TER): | Including Additional Expenses and Goods and Service
Tax on Management Fees |
| Fund Manager | Mr. Dhimant Shah (Since 08 August 2022) Total Experience : 26 years Mr. Rohan Korde (Since 01 December 2022) Total Experience: 17 years |
| AUM (in Rs. Cr): | 2,010.56 |
| AAUM (in Rs. Cr): | 2,157.93 |
| % of top 5 holdings: | 11.95% |
| % of top 10 holdings: | 20.42% |
| No. of scrips: | 80 |
| Standard Deviation^: | 17.58% |
| Beta^: | 0.93 |
| Sharpe Ratio^*: | 0.79 |
| Average P/B | 7.74 |
| Average P/E | 32.76 |
| Portfolio Turnover Ratio | 1.43 |
| ^Computed for the 3-yr period ended ended February 28, 2025. Based on monthly return. * Risk free rate: .40 (Source: FIMMDA MIBOR) | |
Regular Plan
(in Rs.) |
Direct Plan
(in Rs.) |
|
| Growth: | 23.1102 |
25.5111 |
| IDCW: | 22.2955 |
24.6832 |
Name of the Instrument |
% to
NAV |
% to NAV
Derivatives |
|
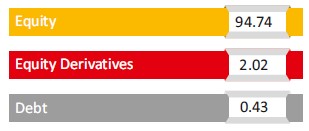
Equity & Equity Related Total |
94.74 |
2.02 |
|
Automobile and Auto Components |
3.99 |
||
Exide Industries Limited |
1.34 |
||
Sundram Fasteners Limited |
0.93 |
||
Ramkrishna Forgings Limited |
0.86 |
||
ZF Commercial Vehicle Control Systems India Limited |
0.86 |
||
Capital Goods |
18.07 |
||
Kirloskar Pneumatic Company Limited |
1.70 |
||
Welspun Corp Limited |
1.56 |
||
Mazagon Dock Shipbuilders Limited |
1.47 |
||
Transrail Lighting Limited |
1.37 |
||
Inox Wind Limited |
1.24 |
||
KSB Limited |
1.11 |
||
Praj Industries Limited |
1.06 |
||
PTC Industries Limited |
1.00 |
||
Apar Industries Limited |
0.96 |
||
Bharat Dynamics Limited |
0.94 |
||
Ingersoll Rand (India) Limited |
0.93 |
||
Hi-Tech Pipes Limited |
0.92 |
||
Jyoti CNC Automation Ltd |
0.87 |
||
Kirloskar Oil Engines Limited |
0.84 |
||
Premier Energies Limited |
0.78 |
||
Finolex Industries Limited |
0.70 |
||
Titagarh Rail Systems Limited |
0.60 |
||
Chemicals |
7.21 |
||
Sumitomo Chemical India Limited |
1.31 |
||
Deepak Fertilizers and Petrochemicals Corporation Limited |
1.25 |
||
Solar Industries India Limited |
1.24 |
||
Neogen Chemicals Limited |
1.20 |
||
Paradeep Phosphates Limited |
1.13 |
||
Epigral Limited |
1.08 |
||
Construction |
2.16 |
||
Techno Electric & Engineering Company Limited |
1.14 |
||
NCC Limited |
1.02 |
||
Construction Materials |
2.07 |
||
JK Cement Limited |
1.15 |
||
Birla Corporation Limited |
0.91 |
||
Consumer Durables |
8.55 |
||
PG Electroplast Limited |
3.62 |
||
Dixon Technologies (India) Limited |
1.78 |
||
Blue Star Limited |
1.61 |
||
Safari Industries (India) Limited |
1.18 |
||
Senco Gold Limited |
0.36 |
||
Consumer Services |
2.57 |
||
Zomato Limited |
1.43 |
||
Cartrade Tech Limited |
1.14 |
||
Fast Moving Consumer Goods |
5.17 |
||
Radico Khaitan Limited |
1.75 |
||
ITC Limited |
1.39 |
||
Jyothy Labs Limited |
1.10 |
||
Adani Wilmar Limited |
0.93 |
||
Financial Services |
19.79 |
0.54 |
|
Multi Commodity Exchange of India Limited |
2.03 |
||
BSE Limited |
1.95 |
||
Karur Vysya Bank Limited |
1.67 |
||
Home First Finance Company India Limited |
1.52 |
||
Cholamandalam Investment and Finance Company Ltd |
1.39 |
||
KFin Technologies Limited |
1.30 |
||
One 97 Communications Limited |
1.19 |
||
City Union Bank Limited |
1.14 |
||
The Federal Bank Limited |
1.07 |
||
PNB Housing Finance Limited |
1.06 |
||
Bank of Maharashtra |
1.00 |
||
Computer Age Management Services Limited |
1.00 |
||
PB Fintech Limited |
0.94 |
||
Nippon Life India Asset Management Limited |
0.90 |
||
Share India Securities Limited |
0.70 |
||
Manappuram Finance Limited |
0.53 |
||
REC Limited |
0.40 |
0.54 |
|
Forest Materials |
1.38 |
||
Aditya Birla Real Estate Limited |
1.38 |
||
Healthcare |
12.00 |
||
Ami Organics Limited |
2.57 |
||
Sun Pharmaceutical Industries Limited |
1.73 |
||
Suven Pharmaceuticals Limited |
1.53 |
||
Wockhardt Limited |
1.48 |
||
JB Chemicals & Pharmaceuticals Limited |
1.41 |
||
Aster DM Healthcare Limited |
1.31 |
||
Krishna Institute Of Medical Sciences Limited |
1.22 |
||
Neuland Laboratories Limited |
0.75 |
||
Information Technology |
3.50 |
||
KPIT Technologies Limited |
1.35 |
||
Zaggle Prepaid Ocean Services Limited |
1.11 |
||
Affle (India) Limited |
1.04 |
||
Media, Entertainment & Publication |
1.38 |
||
Saregama India Limited |
1.38 |
||
Metals & Mining |
1.08 |
1.48 |
|
Jindal Stainless Limited |
1.08 |
||
Jindal Steel & Power Limited |
0.59 |
||
Vedanta Limited |
0.89 |
||
Oil Gas & Consumable Fuels |
1.39 |
||
Gulf Oil Lubricants India Limited |
1.39 |
||
Realty |
1.06 |
||
Sobha Limited |
1.06 |
||
Services |
0.68 |
||
GMR Airports Limited |
0.68 |
||
Textiles |
1.34 |
||
Arvind Limited |
1.34 |
||
Utilities |
1.36 |
||
VA Tech Wabag Limited |
1.36 |
||
Mutual Fund Units |
0.43 |
||
ITI Dynamic Bond Fund -Direct Plan -Growth Option |
0.25 |
||
ITI Banking & PSU Debt Fund -Direct Plan -Growth Option |
0.18 |
||
Short Term Debt & Net Current Assets |
2.80 |
Top Ten Holdings
Value of Investment of 10,000 |
||||||
| Period | Fund Returns (%) |
Benchmark Returns (%) |
Additional Benchmark Returns (%) |
Fund () |
Benchmark () |
Additional Benchmark () |
Regular - Growth |
||||||
| Last 1 Year | 0.11% |
-6.94% |
1.89% |
10,011 |
9,306 |
10,189 |
| Last 3 Years | 20.18% |
16.77% |
10.92% |
17,368 |
15,929 |
13,652 |
| Last 5 Years | 19.37% |
24.46% |
15.94% |
24,265 |
29,902 |
20,966 |
| Since Inception | 18.10% |
22.79% |
14.18% |
23,110 |
28,115 |
19,497 |
Direct - Growth |
||||||
| Last 1 Year | 1.76% |
-6.94% |
1.89% |
10,176 |
9,306 |
10,189 |
| Last 3 Years | 22.36% |
16.77% |
10.92% |
18,329 |
15,929 |
13,652 |
| Last 5 Years | 21.74% |
24.46% |
15.94% |
26,767 |
29,902 |
20,966 |
| Since Inception | 20.44% |
22.79% |
14.18% |
25,511 |
28,115 |
19,497 |
Past performance may or may not be sustained in future and is not a guarantee of any future returns, and should not be used as a basis of comparison with other investments. The performance data for 5 years period has not been provided, since scheme is in existence for less than 5 years. In case, the start / end date of the concerned period is a non-business date (NBD), the NAV of the previous date is considered for computation of returns. Different Plans i.e. Regular Plan and Direct Plan under the scheme have different expense structure. Benchmark: Nifty Small Cap 250 TRI Additional Benchmark: Nifty 50 TRI. Fund Managers: Mr. Dhimant Shah (Managing since 08-August-2022) and Mr. Rohan Korde (Managing since 01-December-2022). Inception date of the scheme (Since 17-Feb-20). Face Value per unit: Rs. 10.Since the scheme is in existence for more than 3 years but less than 5 years hence performance data for 5 years is not provided.
ITI Small Cap Fund NAV as on February 28, 2025: Rs. 23.1102 (Regular Growth Option), Rs. 25.5111 (Direct Growth Option)
| Period | Amount Invested |
Fund Returns (%) |
Benchmark Returns (%) |
Additional Benchmark Returns (%) |
Fund Value () |
Benchmark Value () |
Additional Benchmark Value () |
Regular - Growth |
|||||||
| Last 1 Year | 1,20,000 |
-25.86% |
0.00% |
-11.93% |
1,02,676 |
99,248 |
1,12,215 |
| Last 3 Year | 3,60,000 |
17.27% |
12.56% |
8.74% |
4,64,214 |
4,34,009 |
4,10,521 |
| Last 5 Year | 6,00,000 |
19.34% |
21.25% |
13.16% |
9,70,452 |
10,16,622 |
8,34,173 |
| Since Inception | 6,10,000 |
19.29% |
21.32% |
13.20% |
9,93,562 |
10,44,600 |
8,53,764 |
Direct - Growth |
|||||||
| Last 1 Year | 1,20,000 |
-24.59% |
0.00% |
-11.93% |
1,03,570 |
99,248 |
1,12,215 |
| Last 3 Year | 3,60,000 |
19.44% |
12.56% |
8.74% |
4,78,564 |
4,34,009 |
4,10,521 |
| Last 5 Year | 6,00,000 |
21.69% |
21.25% |
13.16% |
10,27,438 |
10,16,622 |
8,34,173 |
| Since Inception | 6,10,000 |
21.63% |
21.32% |
13.20% |
10,52,619 |
10,44,600 |
8,53,764 |
Past performance may or may not be sustained in future and is not a guarantee of any future returns, and should not be used as a basis of comparison with other investments. Different Plans i.e. Regular Plan and Direct Plan under the scheme have different expense structure. Benchmark: Nifty Smallcap 250 TRI Additional Benchmark: Nifty 50 TRI. For SIP returns, monthly investment of Rs.10,000 invested on the 1st business day of every month has been considered. CAGR Returns (%) are computed after accounting for the cash flow by using the XIRR method (investment internal rate of return).
Disclaimer - Fund SIP Performance
The performance details provided herein are of Growth option under Direct and Regular Plans. The Fund(s) offer Systematic Investment Plan (SIP) facility. To illustrate the advantages of SIP investments, this is how your investments would have grown if you had invested say Rs. 10,000 systematically on the first Business Day of every month over a period of time in the Growth Option of respective scheme. The returns are calculated by XIRR approach assuming investment of 10,000/- on the 1st working day of every month. XIRR helps in calculating return on investments given an initial and final value and a series of cash inflows and outflows with correct allowance for the time impact of the transactions.
THIS PRODUCT IS SUITABLE FOR INVESTORS WHO ARE SEEKING^
- Capital appreciation over long term
- Investment in a diversified Portfolio predominantly consists of equity and equity related instruments of small cap companies
^Investors should consult their financial advisers if in doubt about whether the product is suitable for them.
Face Value per Unit: Rs. 10 unless other wise specified; Data is as of February 28, 2025 unless other wise specified.
Mutual Fund investments are subject to market risks, read all scheme related documents carefully