| CATEGORY OF SCHEME | Arbitrage Fund |
| INVESTMENT OBJECTIVE | The investment objective of the Scheme is to generate income by predominantly investing in arbitrage opportunities in the cash and the derivative segments of the equity markets and the arbitrage opportunities available within the derivative segment and by investing the balance in debt and money market instruments. However, there is no assurance that the investment objective of the scheme will be realized. |
| Inception Date (Date of Allotment): | 09-Sep-19 |
| Benchmark: | Nifty 50 Arbitrage Index |
| Minimum Application Amount: | Rs.5,000/- and in multiples of Rs. 1/- thereafter |
| Load Structure: | Entry Load: Nil Exit Load: If the Units are redeemed / switched out on or before 30 days from the date of allotment - 0.25% If the Unit s are redeemed /switched out after 30 days from the date of allotment - NIL |
| Total Expense Ratio (TER): | Including Additional Expenses and Goods and Service Tax on Management Fees Regular Plan:0.97% Direct Plan: 0.22% |
| Fund Manager | Mr. Vikrant Mehta (Since 18-Jan-21)
Total Experience: 28 years Mr. Rohan Korde (Since 29-Apr-22) Total Experience: 19 years |
| AUM (in Rs. Cr): | 9.09 |
| AAUM (in Rs. Cr): | 9.31 |
| Average Maturity: | 3 Day |
| Macaulay Duration: | 3 Day |
| Modified Duration: | 3 Day |
| Yield to Maturity: | 5.87% |
| Standard Deviation^: | 1.10% |
| Beta^: | 0.26 |
| Sharpe Ratio^*: | -3.08 |
| * Risk free rate: 6.17 (Source: FIMMDA MIBOR) ^Scheme has not completed 3 year s hence NA |
|
Regular Plan
(in Rs.) |
Direct Plan
(in Rs.) |
|
| Growth: | 10.8964 |
11.1517 |
| IDCW: | 10.8964 |
11.1517 |
Name of the Instrument |
% to
NAV |
% to NAV
Derivatives |
Equity & Equity Related Total |
67.33 |
-67.58 |
Automobile and Auto Components |
5.83 |
-5.84 |
Maruti Suzuki India Limited |
5.83 |
-5.84 |
Capital Goods |
1.68 |
-1.68 |
Siemens Limited |
1.68 |
-1.68 |
Consumer Durables |
1.47 |
-1.48 |
Asian Paints Limited |
1.47 |
-1.48 |
Fast Moving Consumer Goods |
2.84 |
-2.86 |
Marico Limited |
2.84 |
-2.86 |
Financial Services |
27.24 |
-27.35 |
Bajaj Finance Limited |
7.06 |
-7.09 |
Housing Development Finance Corporation Limited |
4.53 |
-4.55 |
ICICI Bank Limited |
3.91 |
-3.93 |
HDFC Life Insurance Company Limited |
3.21 |
-3.22 |
HDFC Bank Limited |
2.58 |
-2.59 |
Canara Bank |
2.04 |
-2.05 |
Axis Bank Limited |
1.94 |
-1.94 |
IndusInd Bank Limited |
1.17 |
-1.18 |
Kotak Mahindra Bank Limited |
0.80 |
-0.80 |
Information Technology |
11.17 |
-11.17 |
Tata Consultancy Services Limited |
4.46 |
-4.47 |
MphasiS Limited |
2.41 |
-2.42 |
HCL Technologies Limited |
2.15 |
-2.14 |
Tech Mahindra Limited |
1.33 |
-1.34 |
Birlasoft Limited |
0.81 |
-0.81 |
Metals & Mining |
7.60 |
-7.64 |
Adani Enterprises Limited |
7.60 |
-7.64 |
Power |
1.61 |
-1.62 |
Tata Power Company Limited |
1.61 |
-1.62 |
Services |
7.90 |
-7.95 |
Adani Ports and Special Economic Zone Limited |
7.90 |
-7.95 |
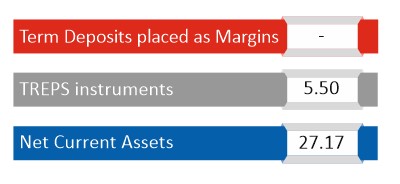
Short Term Debt & Net Current Assets |
32.67 |
|
| Zero credit risk on Arbitrage investments | |
| Lowest risk product in Equity segment | |
| Tax efficient returns with low volatility | |
| Fully hedged portfolio | |
| Ideal investment option for investors with short to medium term investment horizon |
|
| Better liquidity |
|
| Alternate option to Traditional Investment | |
| Market neutral strategy |
|
Value of Investment of 10,000 |
||||||
| Period | Fund Returns (%) |
Benchmark Returns (%) |
Additional Benchmark Returns (%) |
Fund () |
Benchmark () |
Additional Benchmark () |
Regular - Growth |
||||||
| Last 1 Year | 2.22% |
3.75% |
3.18% |
10,222 |
10,375 |
10,318 |
| Last 3 Years | 2.80% |
3.54% |
4.48% |
10,864 |
11,102 |
11,406 |
| Since Inception | 2.84% |
3.55% |
4.55% |
10,896 |
11,128 |
11,459 |
Direct - Growth |
||||||
| Last 1 Year | 3.01% |
3.75% |
3.18% |
10,301 |
10,375 |
10,318 |
| Last 3 Years | 3.58% |
3.54% |
4.48% |
11,113 |
11,102 |
11,406 |
| Since Inception | 3.63% |
3.55% |
4.55% |
11,152 |
11,128 |
11,459 |
Past performance may or may not be sustained in future. Different Plans i.e. Regular Plan and Direct Plan under the scheme have different expense structure. Benchmark: Nifty 50 Arbitrage Index #Additional Benchmark: CRISIL 1 Year T-Bill Index. Fund Managers: Mr. Vikrant Mehta from (Since 18-Jan-21). Mr. Rohan Korde (Since 29-Apr-22). Inception date of the scheme (09-Sep-19). Face Value per unit: Rs. 10.
| Period | Amount Invested |
Fund Value () |
Fund Returns (%) |
Benchmark Value () |
Benchmark Returns (%) |
Additional Benchmark Value () |
Additional Benchmark Returns (%) |
Regular - Growth |
|||||||
| Last 1 Year | 120000 |
121523 |
2.37% |
122441 |
3.80% |
122165 |
3.37% |
| Last 3 Years | 360000 |
373665 |
2.44% |
380543 |
3.64% |
381014 |
3.72% |
| Since Inception | 360000 |
373665 |
2.44% |
380543 |
3.64% |
381014 |
3.72% |
Direct - Growth |
|||||||
| Last 1 Year | 120000 |
122034 |
3.16% |
122441 |
3.80% |
122165 |
3.37% |
| Last 3 Years | 360000 |
378132 |
3.22% |
380543 |
3.64% |
381014 |
3.72% |
| Since Inception | 360000 |
378132 |
3.22% |
380543 |
3.64% |
381014 |
3.72% |
Past performance may or may not be sustained in future. Different Plans i.e. Regular Plan and Direct Plan under the scheme have different expense structure. Benchmark: Nifty 50 Arbitrage Index # Additional Benchmark: CRISIL 1 Year T-Bill Index. For SIP returns, monthly investment of Rs.10,000 invested on the 1st business day of every month has been considered. CAGR Returns (%) are computed after accounting for the cash flow by using the XIRR method (investment internal rate of return).
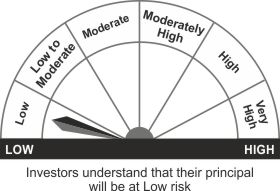
THIS PRODUCT IS SUITABLE FOR INVESTORS WHO ARE SEEKING^
- To generate income by predominantly investing in arbitrage opportunities
- Investments predominantly in arbitrage opportunities in the cash and derivative segments of the equity markets and the arbitrage opportunities available within the derivative segment and by investing the balance in debt and money market instruments
^Investors should consult their financial advisers if in doubt about whether the product is suitable for them.
Face Value per Unit: Rs. 10 unless other wise specified; Data is as of September 30, 2022 unless other wise specified.
Mutual Fund investments are subject to market risks, read all scheme related documents carefully