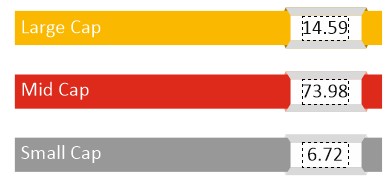
| CATEGORY OF SCHEME | Mid Cap Fund |
| INVESTMENT OBJECTIVE | The investment objective of the Scheme is to seek to generate long term capital appreciation by predominantly investing in equity and equity related securities of Mid Cap stocks. However, there can be no assurance that the investment objective of the scheme would be achieved. |
| Inception Date (Date of Allotment): | 05-Mar-2021 |
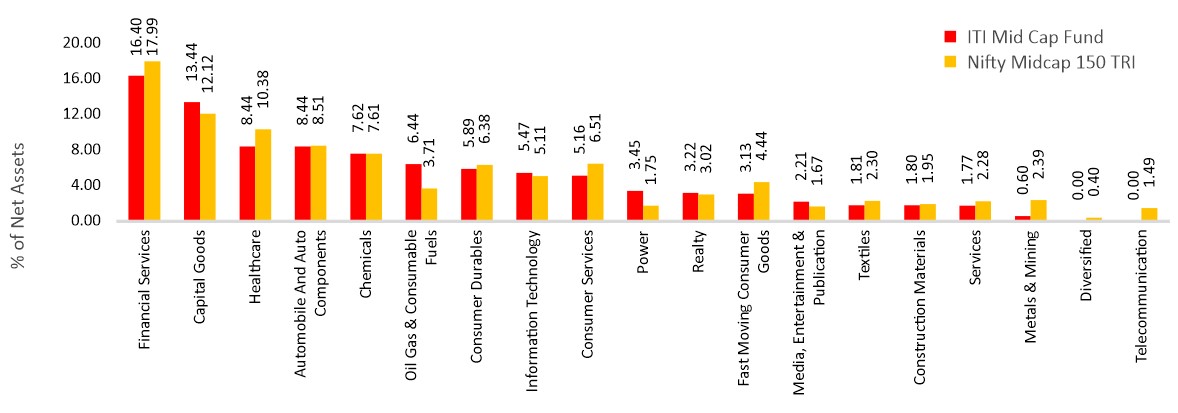
| Benchmark: | Nifty Midcap 150 TRI |
| Minimum Application Amount: | Rs.5,000/- and in multiples of Rs. 1/- thereafter |
| Load Structure: | Entry Load: Nil Exit Load: – If units are redeemed /switched out within 12 months - 1%. Nil thereafter |
| Total Expense Ratio (TER): | Including Additional Expenses and Goods and Service Tax on Management Fees Regular Plan: 2.47% Direct Plan: 0.32% |
| Fund Manager | Mr. Pradeep Gokhale (Since 24-Dec-2020) Total Experience: 27 years Ms. Hetal Gada (Since 08 September 2022) Total Experience: 7 years Mr. Rohan Korde (Since 29 April 2022) Total Experience: 19 years |
| AUM (in Rs. Cr): | 411.94 |
| AAUM (in Rs. Cr): | 412.01 |
| % of top 5 holdings: | 16.60% |
| % of top 10 holdings: | 29.29% |
| No. of scrips: | 59 |
| Standard Deviation^: | NA |
| Beta^: | NA |
| Sharpe Ratio^*: | NA |
| Average P/B | 7.42 |
| Average P/E | 41.48 |
| Portfolio Beta | 0.78 years |
| ^Scheme has not completed 3 years hence NA
* Risk free rate: 6.17 (Source: FIMMDA MIBOR) |
|
Regular Plan
(in Rs.) |
Direct Plan
(in Rs.) |
|
| Growth: | 11.5711 |
12.0024 |
| IDCW: | 11.5711 |
12.0024 |
Value of Investment of 10,000 |
||||||
| Period | Fund Returns (%) |
Benchmark Returns (%) |
Additional Benchmark Returns (%) |
Fund () |
Benchmark () |
Additional Benchmark () |
Regular - Growth |
||||||
| Last 1 Year | -3.29% |
3.65% |
-1.64% |
9,671 |
10,365 |
9,836 |
| Since Inception | 9.72% |
18.26% |
10.46% |
11,571 |
13,017 |
11,694 |
Direct - Growth |
||||||
| Last 1 Year | -1.02% |
3.65% |
-1.64% |
9,898 |
10,365 |
9,836 |
| Since Inception | 12.31% |
18.26% |
10.46% |
12,002 |
13,017 |
11,694 |
Past performance may or may not be sustained in future. Different Plans i.e. Regular Plan and Direct Plan under the scheme have different expense structure. Benchmark: Nifty Midcap 150 TRI # Additional Benchmark: Nifty 50 TRI. Fund Managers: Mr. George Heber Joseph (Since 05-Mar-21). and Mr. Pradeep Gokhale (Since 05-Mar-21). Inception (05-Mar-2021). Face Value per unit: Rs. 10.
| Period | Amount Invested |
Fund Value () |
Fund Returns (%) |
Benchmark Value () |
Benchmark Returns (%) |
Additional Benchmark Value () |
Additional Benchmark Returns (%) |
Regular - Growth |
|||||||
| Last 1 Year | 120000 |
125481 |
8.60% |
125855 |
9.19% |
120442 |
0.69% |
| Since Inception | 180000 |
189804 |
6.90% |
197574 |
12.36% |
187449 |
5.25% |
Direct - Growth |
|||||||
| Last 1 Year | 120000 |
127030 |
11.07% |
125855 |
9.19% |
120442 |
0.69% |
| Since Inception | 180000 |
193318 |
9.37% |
197574 |
12.36% |
187449 |
5.25% |
Past performance may or may not be sustained in future. Different Plans i.e. Regular Plan and Direct Plan under the scheme have different expense structure. Benchmark: Nifty Midcap 150 TRI # Additional Benchmark: Nifty 50 TRI. Mr. Pradeep Gokhale (Since 05-Mar-21). Mr. Rohan Korde (Since 29 April 2022). Inception date of the scheme (05-Mar-2021). Face Value per unit: Rs. 10.
Disclaimer - Fund SIP Performance
The performance details provided herein are of Growth option under Direct and Regular Plans. The Fund(s) offer Systematic Investment Plan (SIP) facility. To illustrate the advantages of SIP investments, this is how your investments would have grown if you had invested say Rs. 10,000 systematically on the first Business Day of every month over a period of time in the Growth Option of respective scheme. The returns are calculated by XIRR approach assuming investment of 10,000/- on the 1st working day of every month. XIRR helps in calculating return on investments given an initial and final value and a series of cash inflows and outflows with correct allowance for the time impact of the transactions.
Name of the Instrument |
% to
NAV |
% to NAV
Derivatives |
|
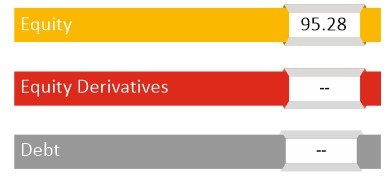
Equity & Equity Related Total |
95.28 |
||
Automobile and Auto Components |
8.44 |
||
Schaeffler India Limited |
2.68 |
||
Bosch Limited |
2.20 |
||
TVS Motor Company Limited |
1.80 |
||
UNO Minda Limited |
1.75 |
||
Capital Goods |
13.44 |
||
ABB India Limited |
3.25 |
||
Bharat Electronics Limited |
2.54 |
||
Hindustan Aeronautics Limited |
1.76 |
||
Honeywell Automation India Limited |
1.61 |
||
SKF India Limited |
1.28 |
||
Cummins India Limited |
1.24 |
||
Ashok Leyland Limited |
0.89 |
||
Thermax Limited |
0.86 |
||
Chemicals |
7.62 |
||
Solar Industries India Limited |
2.38 |
||
Gujarat Fluorochemicals Limited |
2.34 |
||
Sumitomo Chemical India Limited |
1.53 |
||
Vinati Organics Limited |
1.36 |
||
Construction Materials |
1.80 |
||
ACC Limited |
1.09 |
||
Dalmia Bharat Limited |
0.72 |
||
Consumer Durables |
5.89 |
||
Crompton Greaves Consumer Electricals Limited |
2.37 |
||
TTK Prestige Limited |
2.03 |
||
Voltas Limited |
1.49 |
||
Consumer Services |
5.16 |
||
Aditya Birla Fashion and Retail Limited |
4.07 |
||
The Indian Hotels Company Limited |
1.10 |
||
Fast Moving Consumer Goods |
3.13 |
||
Varun Beverages Limited |
2.69 |
||
Procter & Gamble Hygiene and Health Care Limited |
0.43 |
||
Financial Services |
16.40 |
||
The Federal Bank Limited |
3.39 |
||
Sundaram Finance Limited |
2.98 |
||
Max Financial Services Limited |
2.91 |
||
Aavas Financiers Limited |
2.40 |
||
Cholamandalam Investment and Finance Company Ltd |
1.79 |
||
Bank of Baroda |
1.64 |
||
Aditya Birla Sun Life AMC Limited |
0.80 |
||
HDFC Bank Limited |
0.49 |
||
Healthcare |
8.44 |
||
Natco Pharma Limited |
2.10 |
||
Max Healthcare Institute Limited |
1.65 |
||
Lupin Limited |
1.60 |
||
GlaxoSmithKline Pharmaceuticals Limited |
1.51 |
||
Fortis Healthcare Limited |
1.21 |
||
Zydus Lifesciences Limited |
0.37 |
||
Information Technology |
5.47 |
||
Coforge Limited |
1.91 |
||
L&T Technology Services Limited |
1.79 |
||
MphasiS Limited |
1.57 |
||
Infosys Limited |
0.19 |
||
Media, Entertainment & Publication |
2.21 |
||
Sun TV Network Limited |
2.21 |
||
Metals & Mining |
0.60 |
||
Jindal Steel & Power Limited |
0.59 |
||
Hindustan Zinc Limited |
0.02 |
||
Oil Gas & Consumable Fuels |
6.44 |
||
Oil India Limited |
1.65 |
||
Indraprastha Gas Limited |
1.45 |
||
Hindustan Petroleum Corporation Limited |
1.35 |
||
Reliance Industries Limited |
1.12 |
||
Castrol India Limited |
0.86 |
||
Power |
3.45 |
||
NTPC Limited |
1.76 |
||
Tata Power Company Limited |
0.88 |
||
Power Grid Corporation of India Limited |
0.81 |
||
Realty |
3.22 |
||
Oberoi Realty Limited |
1.82 |
||
The Phoenix Mills Limited |
1.40 |
||
Services |
1.77 |
||
Blue Dart Express Limited |
0.93 |
||
Container Corporation of India Limited |
0.84 |
||
Textiles |
1.81 |
||
Page Industries Limited |
1.81 |
||
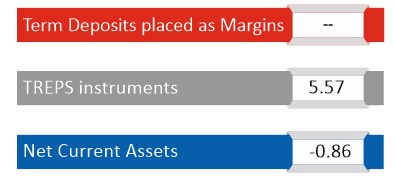
Short Term Debt & Net Current Assets |
4.72 |
Top Ten Holdings
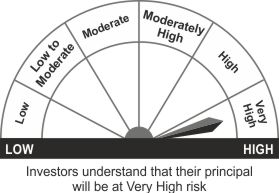
THIS PRODUCT IS SUITABLE FOR INVESTORS WHO ARE SEEKING^
- Capital appreciation over long term
- Investment in a diversified portfolio predominantly consisting of equity and equity related instruments of mid cap companies
^Investors should consult their financial advisers if in doubt about whether the product is suitable for them.
Face Value per Unit: Rs. 10 unless other wise specified; Data is as of September 30, 2022 unless other wise specified.
Mutual Fund investments are subject to market risks, read all scheme related documents carefully